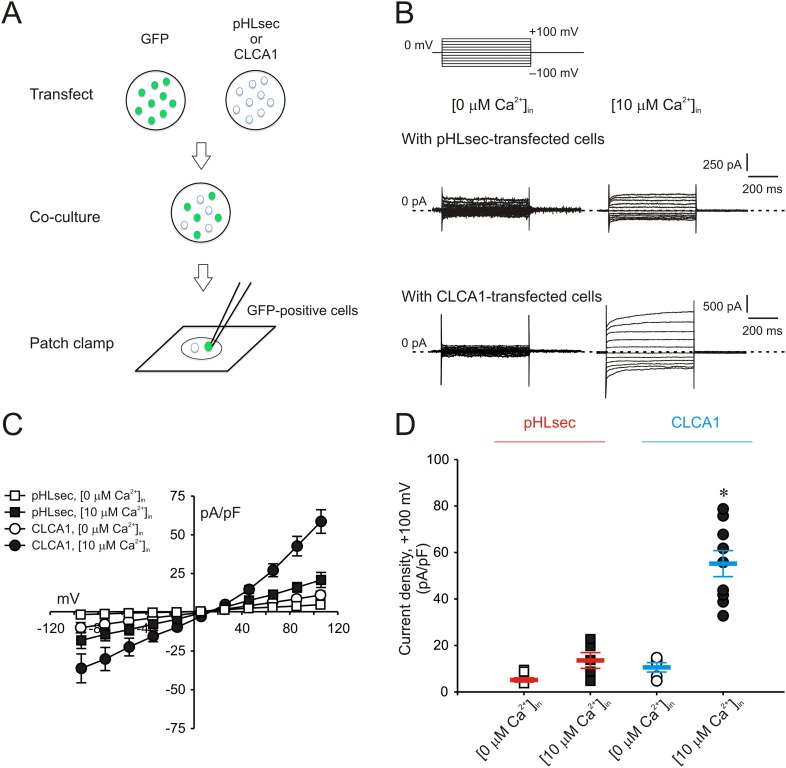
Figure 1. Paracrine activation of calcium-dependent chloride currents in HEK293T cells by CLCA1.
(A) GFP-expressing cells were co-cultured with pHLsec- or CLCA1-transfected cells, and assayed for ICaCC by patch clamp electrophysiology. (B–C) Whole-cell currents measured in GFP-positive cells from experiments as in (A), superfused with standard extracellular solution, and in the absence or presence of 10 μM free Ca2+ in the pipette (respectively, [0 μM Ca2+]in or [10 μM Ca2+]in). (B) Representative current traces. The pulse protocol is shown at the top left. Outward currents are represented by upward deflections, and dotted lines indicate zero current. Membrane capacitance was similar in all cases at ∼25 pF. (C) Current–voltage relationships at the end of the 600-ms voltage steps. Membrane potential values were corrected off-line for the calculated liquid junction potentials, respectively −5.5 mV ([0 μM Ca2+]in) and −6.0 mV ([10 μM Ca2+]in). Data are presented as means ± S.E. (n = 5–9). (D) Current density at +100 mV, from the same experiments as in (C). Symbols represent data from individual patches; bars indicate the means ± S.E. of all experiments. *p < 0.01 (one-way ANOVA, F = 30.3 and p = 1.2 × 10⁻⁷; followed by Tukey test).

