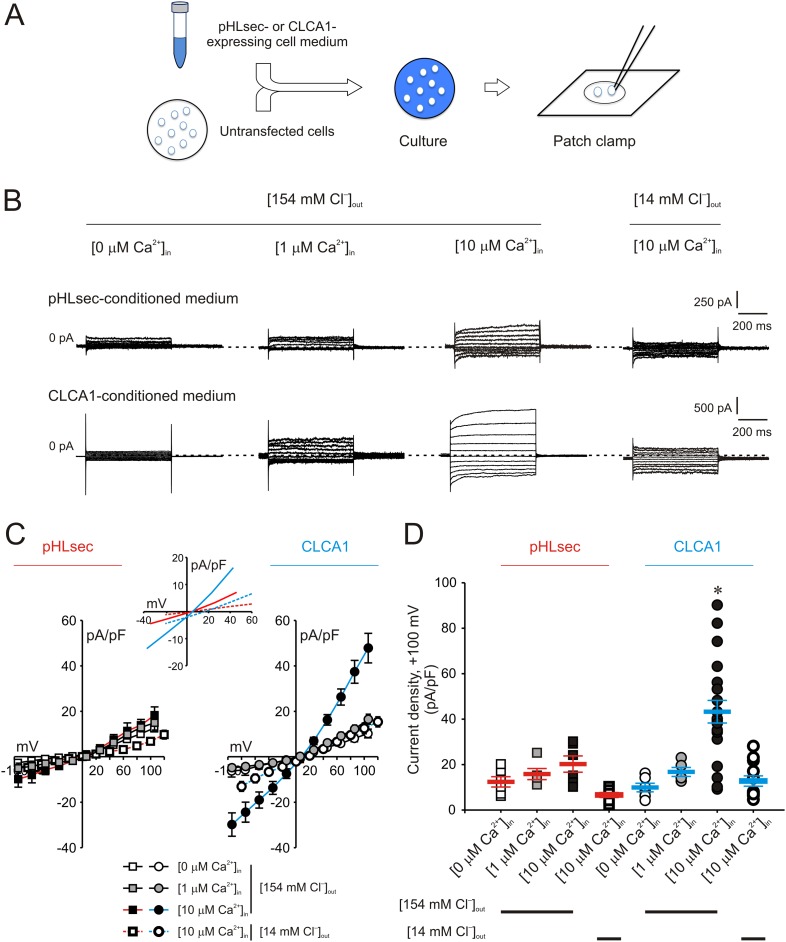
Figure 2. Activation of calcium-dependent chloride currents by secreted CLCA1.
(A) Untransfected cells were cultured in medium from pHLsec- or CLCA1-expressing cells, and assayed by patch clamp electrophysiology. (B–D) Whole-cell currents measured in cells from experiments as in (A), superfused with standard ([154 mM Cl−]out) or reduced Cl− ([14 mM Cl−]out) extracellular solution; and in the absence or presence of 1 μM or 10 μM free Ca2+ in the pipette (respectively, [0 μM Ca2+]in, [1 μM Ca2+]in or [10 μM Ca2+]in). (B) Representative current traces obtained with the same pulse protocol and displayed as in Figure 1B. Membrane capacitance was similar in all cases at ∼25 pF. (C) Current-voltage relationships at the end of the 600-ms voltage steps. Membrane potential values were corrected off-line for the calculated liquid junction potentials, respectively −5.5 mV ([0 μM Ca2+]in) and −6.0 mV ([1 μM Ca2+]in and [10 μM Ca2+]in) for the experiments in [154 mM Cl−]out; and −20 mV for the experiments in [14 mM Cl−]out. Data are presented as means ± S.E. (n = 5–20). Inset, CLCA1-mediated currents right-shifted ∼ +15 mV upon reduction of extracellular Cl−; symbols have been removed for clarity. (D) Current density at +100 mV, from the same experiments as in (C). Symbols represent data from individual patches; bars indicate the means ± S.E. of all experiments. *p < 0.01 (one-way ANOVA, F = 10.4 and p = 2.1 × 10⁻⁸; followed by Tukey test).

