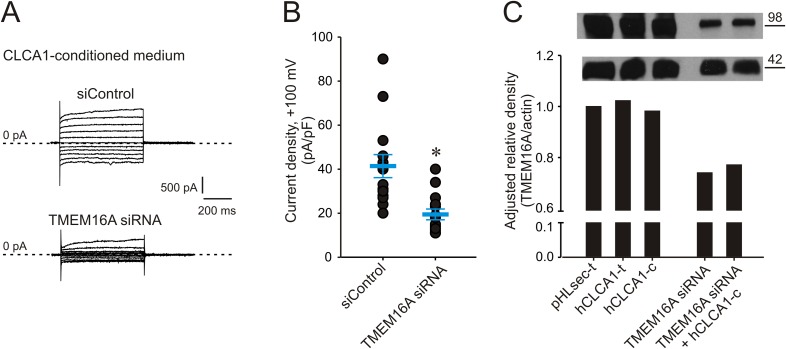
Figure 3. Genetic knockdown of TMEM16A inhibits CLCA1-mediated calcium-dependent chloride currents.
(A–B) HEK293T cells transfected with RNAi negative control (siControl) or TMEM16A siRNA were incubated in CLCA1-conditioned medium and assayed by patch-clamp electrophysiology, in standard extracellular solution ([154 mM Cl−]out) and 10 μM free Ca2+ in the pipette ([10 μM Ca2+]in). (A) Representative current traces obtained with the same pulse protocol and displayed as in Figure 1B. Membrane capacitance was similar in all cases at ∼25 pF. (B) Current density at +100 mV. Symbols represent data from individual patches (n = 14); bars indicate the means ± S.E. of all experiments. *p < 0.01 (unpaired Student's t test). (C) Effect of CLCA1 and/or TMEM16A siRNA treatment on TMEM16A protein expression. Upper panel: top, TMEM16A; and bottom, actin (loading control) Western blot from solubilized HEK293T cells. Lanes are labeled as follows: pHLsec-t, pHLsec transfected cells; CLCA1-t, CLCA1-transfected cells; CLCA1-c, cells treated with CLCA1-conditioned medium; TMEM16A siRNA, cells transfected with TMEM16A siRNA; TMEM16A siRNA + CLCA1-c, cells transfected with TMEM16A siRNA and treated with CLCA1-conditioned medium. Bar graph: quantitation of TMEM16A band intensity normalized to actin band intensity using ImageJ (NIH).

