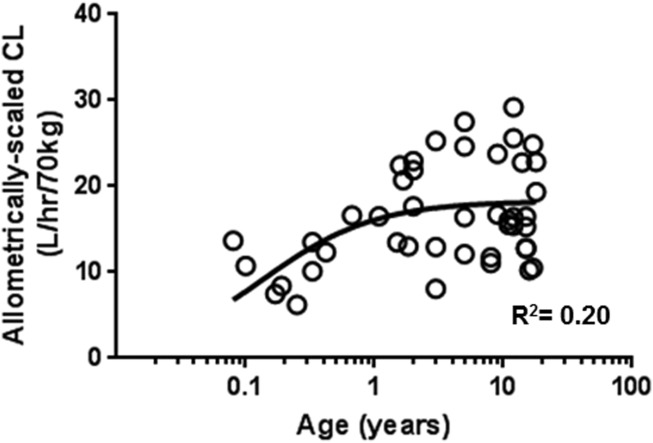
Figure 1.

Allometrically scaled individual sirolimus clearance (CL) vs. age in 44 patients with vascular anomalies. Individual clearances were estimated using concentration at trough with MW-Pharm. The nonlinear regression analysis was conducted with GraphPad Prism. Solid line indicates the nonlinear regression line following Emax model. Each data point represents the clearance estimate of one patient.
