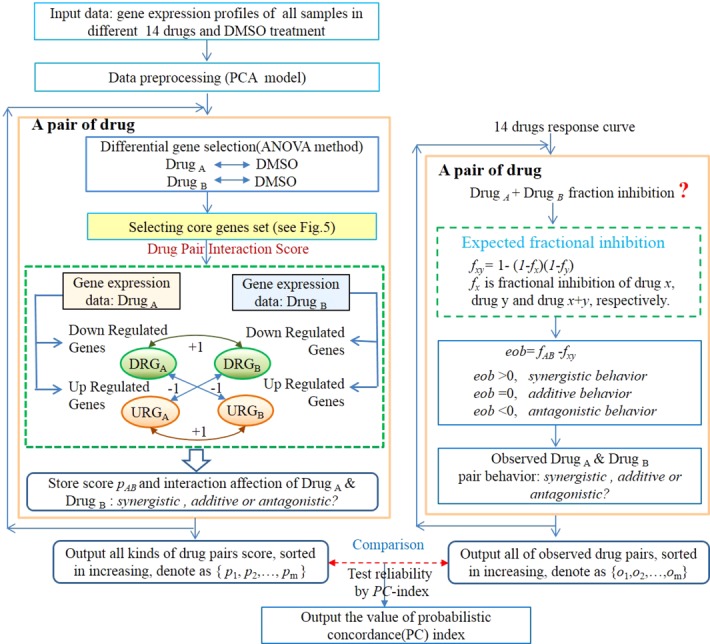
Figure 2.

Schematics of data processing. The data processing flow included three parts: (1) The drug interaction scoring by its gene expression on the left; (2) the drug interaction observation by calculation of single drug response curve, which is shown on the right; (3) the calculation of the PC index of which the comparison between the scoring prediction and the result of the observed experiment, which is shown on the bottom.
