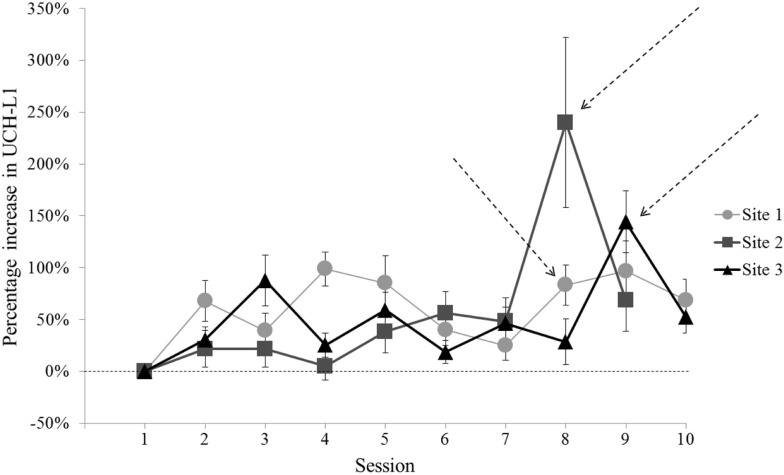
Figure 2.
Normalized UCH-L1 concentrations (relative to individual baseline) for each Session of the study at each of the three sites. Error bars represent standard error. For two of the three sites, there is a Session in the series that shows a high UCH-L1 level that differs from the next highest Session. [Site 2 Session 8 vs. Session 9, t(21) = 2.10, p = 0.048; Site 3 Session 9 vs. Session 3, t(31) = 2.55, p = 0.016]. Site 1 did not show a single Session that clearly met criterion, with pairwise comparisons of Site 1 Sessions with the greatest UCH-L1 concentrations showing no difference (p values >0.05). Session 8 was used to represent post-blast exposure UCH-L1 concentrations for Site 1. Arrows indicate Sessions selected for comparison to baseline (Session 1).

