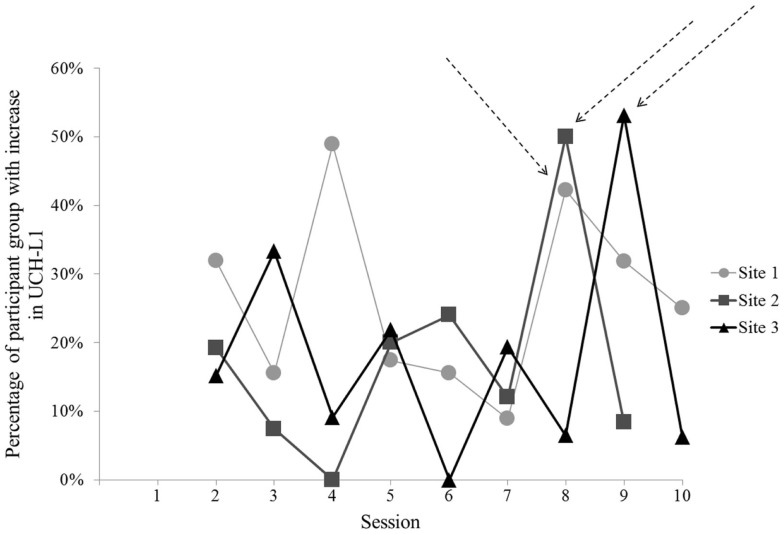
Figure 3.
The percentage of participants showing increase in normalized UCH-L1 from the previous day for each Session at each of the three sites. Session 8 for Sites 1 and 2 and Session 9 for Site 3 show that 40% or more of the subjects showed an increase in UCH-L1. Arrows indicate Sessions selected for comparison to baseline (Session 1). No data are shown for Session 1 in this figure because there was no prior timepoint available to assess daily increase in UCH-L1.

