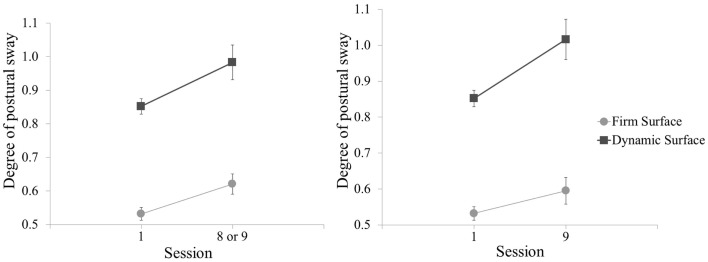
Figure 7.
Mean postural sway (standard deviation from center of gravity) for baseline and post-blast comparison Sessions, shown for test conditions with eyes open on each of two surfaces. Greater degree of postural sway corresponds to worse performance. Left panel is baseline and the post-blast Session with the greatest UCH-L1 increase (Session 8 for Sites 1 and 2, Session 9 for Site 3). Right panel is baseline and the final post-blast Session (Session 9). All three sites are combined. Error bars are standard error.

