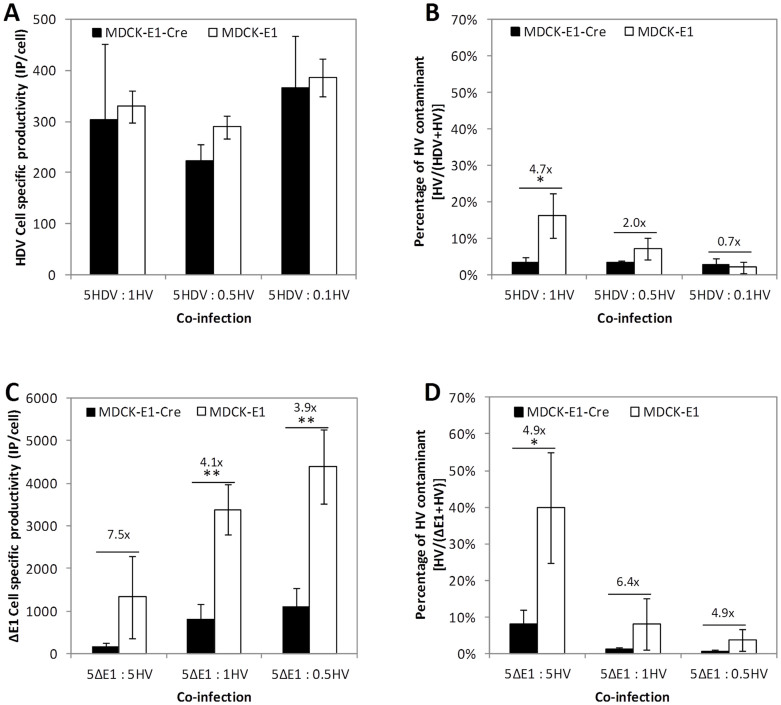
Figure 4. Effect of MOI ratio on virus production and HV contaminant using MDCK-E1-Cre and MDCK-E1 cells.
(A, B) Cell specific productivity of HDV (A) and resulting HV contaminant (B). (C, D) Cell specific productivity of ΔE1 (C) and resulting HV contaminant (D). Values are shown as average ± standard-deviation (n = 3). * p < 0.05, ** p < 0.005, given by a single factor Anova analysis.

