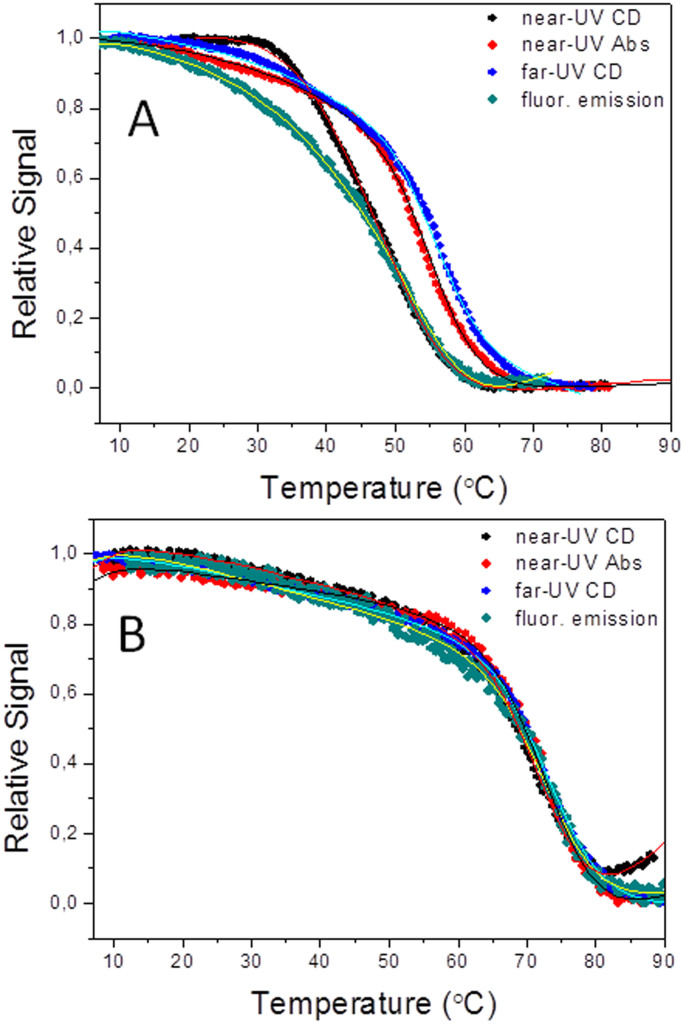
Figure 4. Thermal unfolding of three-state wild type apoflavodoxin (A) and of one thermostabilized two-state apoflavodoxin variant 3M/A142V/G87V/D100N (B) followed by near-UV CD (black), near-UV absorbance (red), far-UV CD (blue) and emission fluorescence (cyan).
The curves are shown roughly normalized to signal spans from 0 to 1 and do not represent fractions of folded protein. For each protein, the global fit of the four curves to a three-state (WT) or a two-state model is represented by the continuous lines.

