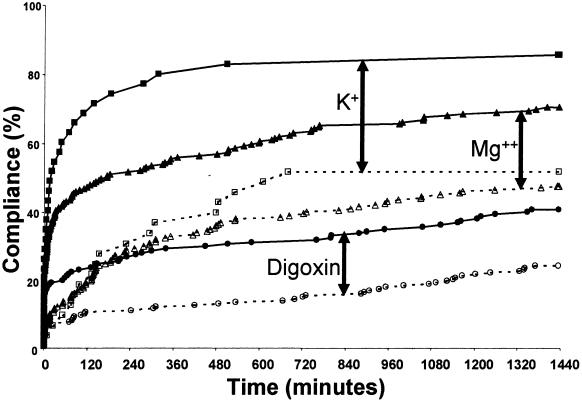
Figure 1.
Compliance curves for unknown digoxin, potassium (K+), and magnesium (Mg2+) levels. Proportions of patients with orders checking digoxin (○), K+ (□), and Mg2+ (▵) levels after digoxin was ordered with no recent levels recorded. The x-axis represents time to clinician order for the laboratory level. Clinician response for the control group is represented by the open symbols (○, □, ▵) and dashed lines, and the response for the study group is indicated by the solid symbols (•, ▪, ▴) and solid lines. Responses for the study group were significantly improved for all three alerts (p < 0.001 using the log-rank statistic). Arrows are included for easier identification of each pair of control/study curves.

