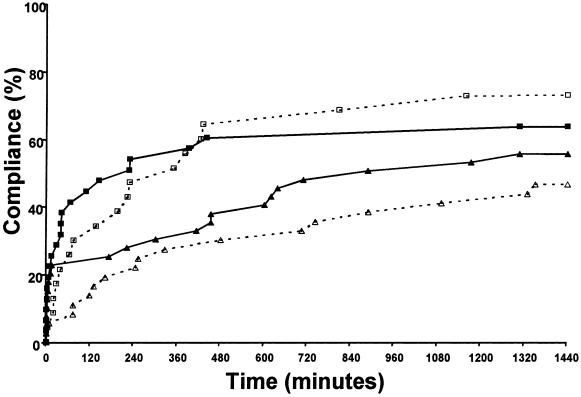
Figure 2.
Compliance curves for synchronous alerts. Proportion of patients with orders for electrolyte supplementation after digoxin was ordered with a low potassium (K+) (□) or magnesium (Mg2+) (▵) levels. The x-axis represents time to clinician order for supplementation. Clinician response is indicated for the control groups with open symbols (□, ▵) and dotted lines and for the study group with solid symbols (▪, ▴) and solid lines. The respective control versus study group curves are not statistically different, but the supplementation of Mg2+ was higher at one hour using Fisher's exact test.

