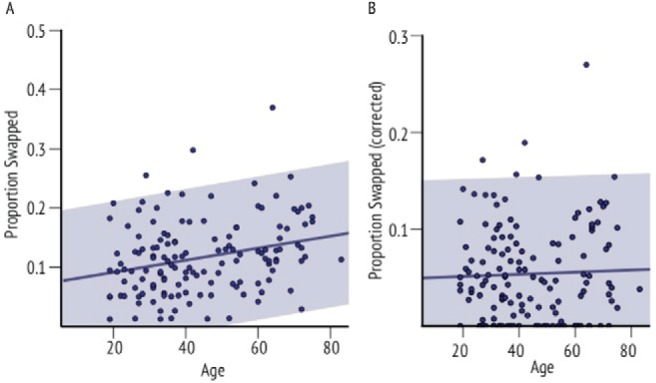
Figure 7.

Swap errors and aging. (a) Linear regression between age and overall proportion of trials where swap errors occurred. (b) Linear regression between age and corrected swap error rate. The 95% confidence intervals are marked in gray shade. See the online article for the color version of this figure.
