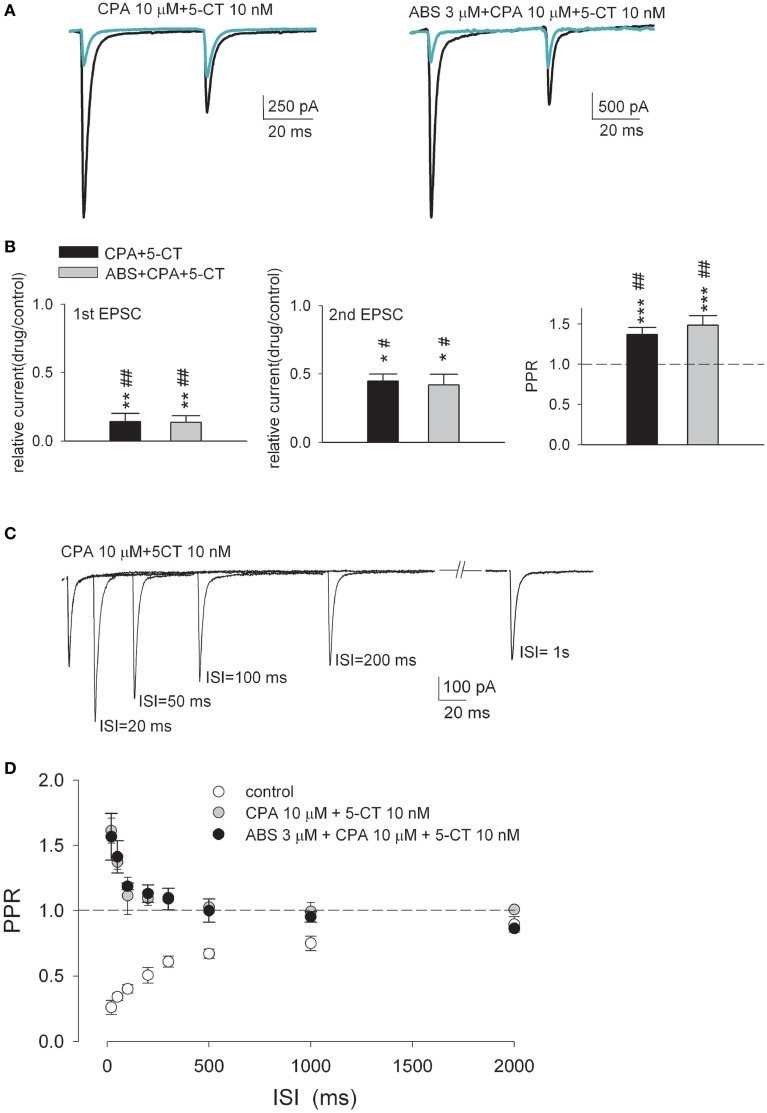
Figure 6.
The short-term depression is transformed into facilitation in the simultaneous presence of both CPA and 5-CT. (A) Representative paired-pulse AMPAR current traces recorded from the same neuron in control (both panels, black lines) and in the presence of 10 μM CPA plus 10 nM 5-CT (left panel, green line) or 10 μM CPA plus 10 nM 5-CT plus 3 μM ABS (right panel, green line). Each trace is the average of three consecutive trials. Stimulus artifacts are omitted for clarity. (B) Summary plot of the 1st EPSC (left panel) or the 2nd EPSC (middle panel) in drug relative to that in control or PPR in drug (right panel) (n = 5–10). The concentrations used are 10 nM, 10 μM, and 3 μM for 5-CT, CPA, and ABS, respectively. The interstimulus interval is 50 ms. The dashed horizontal line indicates the level where PPR equals 1. *p < 0.05, **p < 0.01, ***p < 0.001 when the CPA+5−CT group or the 5−CT+CPA+ABS group are compared to the CPA+ABS group by Student's unpaired t-test. #p < 0.05, ##p < 0.01 when they are compared to the 5-CT+ABS group by Student's unpaired t-test. See also Figure S1 for the data from individual experiments. (C) Overlay of EPSCs from a representative relay neuron in response to paired pulses of varying ISIs in the presence of 10 μM CPA plus 10 nM 5-CT. Traces are the average of three consecutive trials. Stimulus artifacts are blanked for clarity. (D) Plot of the average PPR vs. ISI in the control condition (open circles, n = 10, data from Figure 3) and in the presence of 10 μM CPA plus 10 nM 5-CT (gray circles, n = 6) or in the presence of 10 μM CPA plus 10 nM 5-CT plus 3 μM ABS (black circles, n = 5).

