
Figure 3.
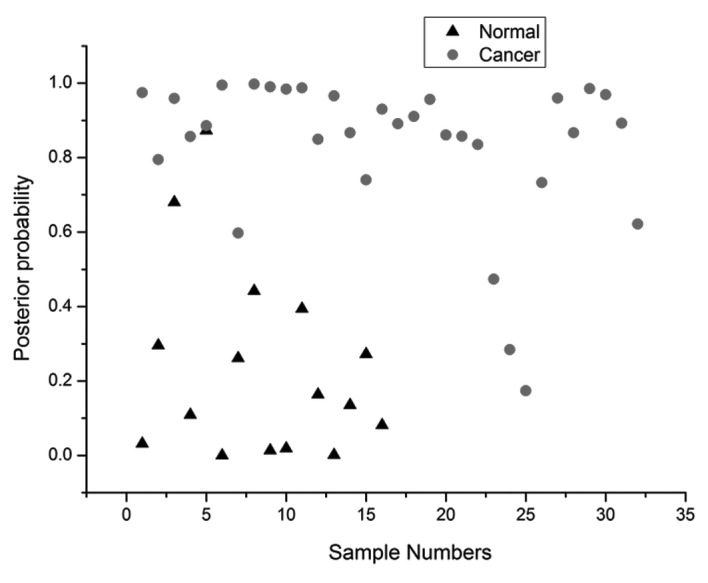
Scatter plot of the posterior probability of belonging to the nasopharyngeal cancer group for the 48 tissue samples calculated from the Raman data using the principal component analysis-linear discriminant analysis-based spectral classification using the leave-one-out cross-validation method.