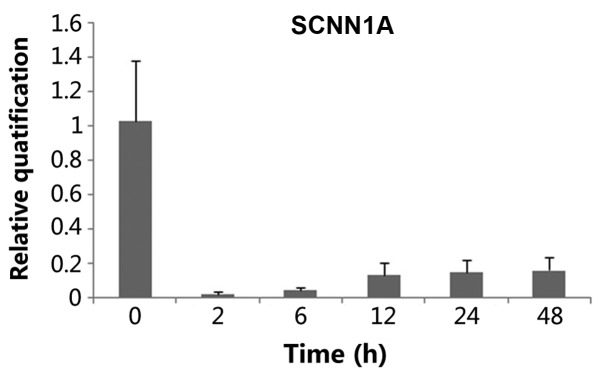
Figure 3.

mRNA expression of α-subunit of the epithelial sodium channel (α-ENaC) by reverse transcription-quantitative polymerase chain reaction. α-ENaC mRNA expression was normalized to the expression of α-ENaC in 0 h (control), which was arbitrarily set to a value of 1. P<0.05 is considered to indicate a significantly different expression and data are expressed as the average ± standard deviation.
