
Figure 1. Immunologic and pharmacokinetic studies.
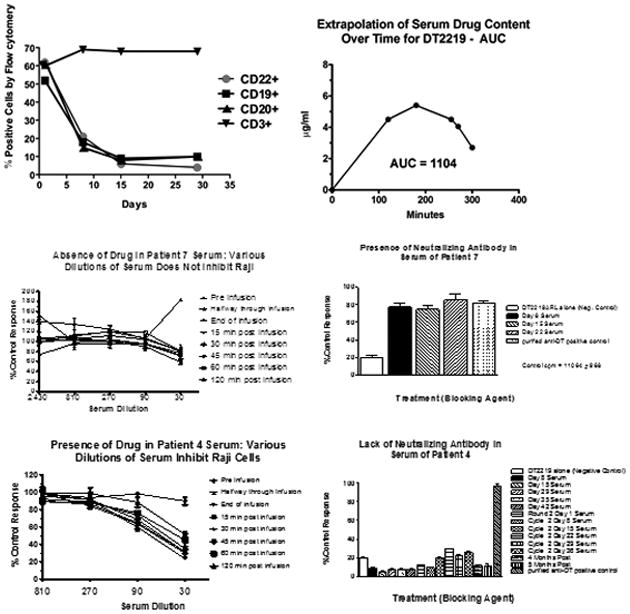
A. Peripheral blood mononuclear cell (PBMC) analysis of a representative patient is shown. PBMCs were enriched from patient blood and collected at various times post-treatment. Flow cytometry was used to count cells expressing CD22, CD19, CD20, or CD3. B. A bioassay was used to determine the area under the curve (AUC) of serum DT2219 levels in serum by measuring the ability of diluted serum to inhibit proliferation of CD22+CD19+ Raji indicator cells. Drug serum levels at various times were analyzed using prism 5.0 software to calculate AUC. A concentration-time curve is shown for our second patient at 60ug/kg. T1/2 was 59 minutes. C. DT2219 serum levels and neutralizing antibodies. Upper panels shows a patient treated at the 80 ug/kg dose level showing no evidence of DT2219 in serum (left) and high levels of neutralizing antibodies at day 8 through 22 (right). In contrast, lower panels shows that a patient treated at 60 ug/kg/day had a serum drug concentration (left) and no detectable neutralizing antibodies (right lower panel). DT2219 serum levels were calculated from assays in which various serum dilutions were tested for their ability to inhibit Raji cell proliferation. Serum collected prior to drug administration served as a negative control. Neutralization assays were performed based on the ability of undiluted patient serum samples to block the killing of a 99% inhibitory dose of DT2219. % neutralization was calculated