Abstract
Histotripsy is an ultrasound ablation method that controls cavitation to fractionate soft tissue. In order to effectively fractionate tissue, histotripsy requires cavitation bubbles to rapidly expand from nanometer-sized initial nuclei into bubbles often larger than 50 microns. Using a negative pressure high enough to initiate a bubble cloud and expand bubbles to a sufficient size, histotripsy has been shown capable of completely fractionating soft tissue into acelluar debris resulting in effective tissue removal. Previous work has shown that the histotripsy process is affected by tissue mechanical properties with stiffer tissues showing increased resistance to histotripsy fractionation, which we hypothesize to be caused by impeded bubble expansion in stiffer tissues. In this study, the hypothesis that increases in tissue stiffness causes a reduction in bubble expansion was investigated both theoretically and experimentally. High speed optical imaging was used to capture a series of time delayed images of bubbles produced inside mechanically tunable agarose tissue phantoms using histotripsy pulses produced by 345 kHz, 500 kHz, 1.5 MHz, and 3 MHz histotripsy transducers. The results demonstrated a significant decrease in maximum bubble radius (Rmax) and collapse time (tc) with both increasing Young’s modulus and increasing frequency. Furthermore, results showed that Rmax was not increased by raising the pressure above the intrinsic threshold. Finally, this work demonstrated the potential of using a dual-frequency strategy to modulate the expansion of histotripsy bubbles. Overall, the results of this study improve our understanding of how tissue stiffness and ultrasound parameters affect histotripsy-induced bubble behavior and provide a rational basis to tailor acoustic parameters for treatment of the specific tissues of interest.
Keywords: Histotripsy, Bubble Expansion, Frequency, Tissue Mechanical Properties
Introduction
Histotripsy is a non-invasive tissue ablation method that controls cavitation to mechanically fractionate soft tissue through high pressure (>10 MPa), short duration (<20 μsec) ultrasound pulses at low duty cycles (<1%) (Parsons et al., 2006a; Roberts et al., 2006; Xu et al., 2005). Histotripsy depends on the initiation and maintenance of a cavitation bubble cloud to produce mechanical tissue fractionation (Parsons et al., 2006a; Xu et al., 2005). In order to effectively fractionate tissue into accelluar debris, histotripsy requires bubbles to rapidly expand from nanometer-sized initial nuclei into large cavitation bubbles greater than ~50μm in diameter (Parsons et al., 2006a; Vlaisavljevich et al., 2013a; Xu et al., 2007). Using a pressure high enough to initiate a bubble cloud and expand bubbles to a sufficient size, histotripsy has been shown capable of completely fractionating soft tissue into a liquid-appearing homogenate with no cellular structures remaining, resulting in effective tissue removal (Hall et al., 2007; Roberts et al., 2006; Vlaisavljevich et al., 2013b; Xu et al., 2005). Previous work has shown that the histotripsy process is affected by tissue mechanical properties with stiffer tissues showing increased resistance to histotripsy-induced fractionation (Vlaisavljevich et al., 2013b; Vlaisavljevich et al., 2014a; Vlaisavljevich et al., 2014c). One possible explanation for the increase in resistance for stiffer tissues is that stiffer tissues impede bubble expansion, therefore reducing the strain applied to tissue structures (Allen and Roy, 2000b; Vlaisavljevich et al., 2014a; Vlaisavljevich et al., 2014c).
There are two mechanisms in which a cavitation cloud can be generated using a single pulse in histotripsy. In the first mechanism, termed the “shock scattering mechanism” of cloud initiation, a dense bubble cloud can be formed from a multi-cycle histotripsy pulse using scattering of the positive shocks from individual bubbles formed and expanded from the initial cycles of the pulse (Maxwell et al., 2011). Using the shock scattering mechanism, histotripsy bubble clouds are initiated at negative pressure magnitudes ranging from 10–28 MPa and are dependent upon multiple factors including the distribution of heterogeneous nuclei in the focal region, the size and shape of initial single bubbles, the strength of the shock front, and the positive pressure amplitudes (Maxwell et al., 2010; Maxwell et al., 2011; Vlaisavljevich et al., 2014b). Increases in tissue stiffness result in higher cloud initiation thresholds when using the shock scattering mechanism of bubble cloud formation (Vlaisavljevich et al., 2014c). The mechanism responsible for this increase in cavitation cloud threshold was hypothesized to be a decrease in the expansion of initial bubbles in tissues with higher Young’s modulus, which leads to reduced shock scattering (Vlaisavljevich et al., 2014c). Results of that study further suggested that bubble cloud formation in tissues with Young’s moduli >100 kPa was primarily driven by the negative pressure of the incident wave while the contributions of shock scattering were significantly decreased, likely due to suppressed bubble expansion (Vlaisavljevich et al., 2014c).
The second mechanism for histotripsy cavitation cloud formation is termed the “intrinsic threshold mechanism”, in which a single pulse with only one high amplitude negative phase can be used to generate a bubble cloud when the peak negative pressure of the incident wave directly exceeds a threshold intrinsic to the medium, without the contributions from shock scattering (Lin et al., 2014b; Maxwell et al., 2013). Using this intrinsic threshold mechanism, the volume of the bubble cloud formation matches the portion of the focal region above the intrinsic threshold (Lin et al., 2014b; Maxwell et al., 2013; Vlaisavljevich et al., 2014c). In contrast to the shock scattering threshold approach, as the intrinsic threshold mechanism of cloud initiation does not rely on the expansion of individual bubbles in order to initiate a bubble cloud, the histotripsy intrinsic threshold is independent of tissue stiffness (Vlaisavljevich et al., 2014c). However, since histotripsy lesions only form when the strain exceeds the ultimate strain of the tissue, it is possible that stiffer tissues may remain resistant to histotripsy fractionation even in cases when a bubble cloud has been generated through the intrinsic threshold mechanism due to impeded bubble expansion (decreased strain applied to tissue) as well as the higher ultimate stresses and strains of these tissues (ability to withstand higher stress and strain) (Vlaisavljevich et al., 2014a; Vlaisavljevich et al., 2014c).
Cavitation bubble dynamics have been shown to be dependent on the viscoelastic properties of the media (Allen and Roy, 2000b, a; Freund, 2008; Jimenez-Fernandez and Crespo, 2005; Yang and Church, 2005; Zabolotskaya et al., 2005). More specifically, bubble expansion has been shown to be suppressed in media with increased Young’s moduli and viscosity (Yang and Church, 2005; Zabolotskaya et al., 2005; Freund, 2008). Similar observations have been made in previous histotripsy studies in which smaller bubbles were observed when histotripsy pulses were applied inside tissue phantoms of increasing stiffness (Vlaisavljevich et al., 2014c; Maxwell et al., 2013). However, these observations have often relied upon images of bubbles at a single time point (Maxwell et al., 2013) or images of bubbles produced using the shock scattering mechanism of cloud initiation (Vlaisavljevich et al., 2014c), making it difficult to determine the actual pressure experienced by the bubble.
In this work, we aim to investigate the effects of tissue stiffness and ultrasound frequency on the temporal behavior of individual bubbles produced by histotripsy pulses using the intrinsic threshold mechanism of cloud generation, as the acoustic field is complicated by the scattering of the positive pressure using the shock scattering approach. We hypothesize that increasing Young’s modulus will suppress bubble expansion, helping to explain the increased damage resistance previously observed for stiffer tissues. Furthermore, we hypothesize that lower frequency will enhance bubble expansion due to the longer rarefactional phase of the applied pulse. To test these hypotheses, histotripsy pulses produced by 345 kHz, 500 kHz, 1.5 MHz, and 3 MHz histotripsy transducers were applied to mechanically tunable agarose tissue phantoms, with the resulting radius vs. time (R-T) curves reconstructed using high speed optical imaging. The results of this work will provide a better understanding of the effects of tissue stiffness and ultrasound frequency on histotripsy which is essential to advance histotripsy and provide rationale to guide parameter optimization for treatment of specific tissues.
Materials and Methods
Bubble Behavior Simulation
To investigate the effects of tissue stiffness and ultrasound frequency on the growth of histotripsy bubbles, a numerical model based on a Kelvin-Voigt viscoelastic model was used. We hypothesize that the first significant tension experienced by a nucleus will cause it to grow explosively, and that the behavior will be affected by the tissue elasticity. To test this hypothesis, simulations exposed a 2.5 nm initial gas nucleus to a single peak negative pressure
| (E1) |
where pA is the peak negative pressure, ω is the angular frequency of the experimental ultrasound wave, δ is a time delay, and n is a curve-fitting parameter set to n=3.7 to closely match the shape of experimental waveforms. A 2.5 nm initial bubble was chosen to model the homogeneous nuclei that are used to generate bubbles in histotripsy using the intrinsic threshold mechanism of cloud initiation. In a previous study using this 2.5 nm initial bubble, the cavitation threshold behavior matched experimental results generated using a single 2-cycle pulse (Maxwell et al., 2013). For this proof of principle, we assume the surrounding medium to have homogeneous properties, and that the bubble contains air and remains spherical. In this study, we use an in-house code developed to simulate spherical bubble dynamics in general viscoelastic media, including compressibility and thermal effects (Warnez and Johnsen, 2014). To describe the bubble response to a far-field pressure variation, pinf (t), we solve the the compressible Keller-Miksis equation
| (E2) |
where ρ is the surrounding medium’s density, c is the speed of sound, S is the surface tension, and μ is the viscosity. Here, the overdots (˙) denote derivatives with respect to time, t. For simplicity, the air within the bubble behaves adiabatically, so that
| (E3) |
where κ =1.4 is the ratio of specific heats for air, R0 is the initial bubble radius, with
| (E4) |
The viscoelasticity of the medium is modeled using a Kelvin-Voigt approach, in which the stress consists of the sum of viscous and elastic contributions. Because of the large deformations during growth, a hyperelastic (Neo-Hookean) constitutive relation is used (Gaudron et al., 2014), to yield the following elastic term, ENT,
| (E5) |
where G is the linear shear modulus. The equations are marched forward in time using explicit Runge-Kutta time marching with adaptive time stepping to compute the radius (and all relevant quantities) as a function of time. The properties ρ =1000 kg/m3, c =1497 m/s2, μ = 1.00 mPa · s (viscosity of water), and S =72 mN-m (water-air surface tension) were used to approximate the surrounding medium. The Young’s modulus (E = 3G) was varied in decades from 1 kPa to 1 MPa to compare the effects of Young’s modulus on bubble expansion. Ultrasound frequencies included 345 kHz, 500 kHz, 1.5 MHz, and 3 MHz for comparison with experimental results. The bubble radius was graphed as a function of time to provide insight into the effects of tissue elasticity, ultrasound frequency, and peak negative pressure on the temporal expansion and collapse of cavitation bubbles during histotripsy. All numerical simulations were conducted using a single bubble model and did not account for potential bubble-bubble interactions that may occur within a histotripsy bubble cloud.
Tissue Phantom with Mechanically Tunable Properties
Agarose phantoms with mechanically tunable properties were used to provide a well-controlled elastic medium for this study. Agarose phantoms of 0.3%, 1%, 2.5%, and 5% w/v were prepared by slowly mixing agarose powder (Agarose Type VII; Sigma-Aldrich, St. Louis, MO, USA) into saline solution (0.9% sodium chloride; Hospira, Lake Forest, Illinois, USA) heated to boiling temperature. The solution was stirred on a hot plate until the gel turned completely transparent and then allowed to boil for ten minutes. After boiling, agarose solutions were allowed to cool and were degassed under a partial vacuum (~20 kPa, absolute) for 30 minutes. After removing agarose mixtures from the vacuum, the solution was poured into tissue phantom holders and placed in a refrigerator at 4°C to allow the agarose solution to solidify prior to use.
The mechanical properties of the 0.3%, 1%, 2.5%, and 5% w/v agarose phantoms were measured using a parallel-pate AR-G2 rheometer (TA Instruments, New Castle, DE, USA) on a Peltier stage, similar to previous studies (Balgude et al., 2001; Ulrich et al., 2010). The stage was initially heated to 90°C, and samples were allowed to melt for 1 minute before the top plate was lowered to create a gap of 1000 μm. The stage was cooled to 60°C and excess agarose solution was wiped off and the gap was sealed with mineral oil (Sigma, St. Louis, MO, USA) to prevent evaporation. Samples were held at 60°C for two minutes to ensure a uniform starting temperature within the fluid, and then cured at 4°C for 20 minutes. The samples were then heated to 20°C for 10 minutes and the mechanical properties were measured. The shear modulus (G) was measured at a frequency of 0.1 radian per second with 0.05% strain for 5% and 2.5% tissue phantoms and 0.1% strain for 1% and 0.3% tissue phantoms. Three independent samples were measured for each weight percent, with the results reported as the mean ± a 95% confidence interval (Table 1). The Young’s modulus (E) was estimated from the shear modulus as E=3G (Table 1).
Table 1. Tissue phantom properties.
Table shows the shear modulus, Young’s modulus, density, and water content for the agarose tissue phantoms. The shear modulus (G) was measured at 20°C using shear rheology. The Young’s modulus was estimated from the shear modulus (E=3G).
| Shear Modulus (kPa) | Young’s Modulus (kPa) | Density (kg/m3) | Water Content (%) | |
|---|---|---|---|---|
| Water | - | - | 998.0 | 100.0 |
| 0.3% Agarose | 0.38±0.16 | 1.13±.047 | 1003.0 | 98.8 |
| 1% Agarose | 7.24±0.34 | 21.7±1.0 | 1010.0 | 98.1 |
| 2.5% Agarose | 80.8±8.9 | 242±27 | 1025.0 | 96.7 |
| 5% Agarose | 190±15 | 570±46 | 1050.0 | 94.3 |
Histotripsy Pulse Generation
Histotripsy pulses were generated at four different ultrasound frequencies (345 kHz, 500 kHz, 1.5 MHz, and 3 MHz) using three custom-built histotripsy transducers developed in house. The 345 kHz histotripsy pulses were generated by a twenty-element array transducer with a geometric focus of 150 mm, an aperture size of 272 mm, and an effective f-number of 0.55. The 1.5 MHz histotripsy pulses were generated using a six-element array transducer with a geometric focus of 55mm, an aperture of 79 mm in the elevational direction and 69 mm in the lateral direction, and effective f-numbers of 0.7 and 0.8 in the elevational and lateral directions, respectively. The 500 kHz and 3 MHz pulses were generated by a dual frequency array transducer that consisted of twelve 500-kHz elements and seven 3-MHz elements. For the 500 kHz elements, the geometric focus was 40 mm, the aperture size was 71 mm, and the effective f-number was 0.56. For the 3 MHz elements, the geometric focus was 40 mm, the aperture size was 80 mm, and the effective f-number was 0.5. The design of this dual frequency transducer has been described in detail in a previous study (Lin et al., 2014a).
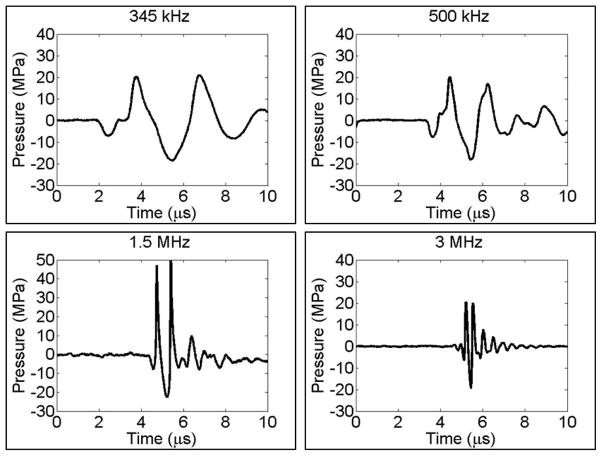
To generate short therapy pulses, a custom high-voltage pulser developed in-house was used to drive the transducers. The pulser was connected to a field-programmable gate array (FPGA) development board (Altera DE1 Terasic Technology, Dover, DE, USA) specifically programmed for histotripsy therapy pulsing. This setup allowed the transducers to output short pulses consisting only one high peak negative phase. This very short pulse minimized the possibility of cavitation occurring through shock scattering, therefore cavitation would be generated only by the negative-pressure half cycle of the incident wave. A fiber-optic probe hydrophone (FOPH) built in-house (Parsons et al., 2006b) was used to measure the acoustic output pressure of the transducers. At peak negative pressure levels higher than 20 MPa, the acoustic output couldn’t be directly measured due to cavitation generation at the fiber tip. The higher pressures were estimated by a summation of the pressure values from individual transducer elements. In a previous study (Maxwell et al., 2013), the estimated pressure from the linear summation, P(-)LS, had a good agreement with the p- measured directly at peak negative pressure up to 30MPa in a higher cavitation threshold medium, 1,3 butanediol. Sample acoustic waveforms produced by the four frequency transducers are shown in Figure 1.
Figure 1. Example histotripsy waveforms.
Representative free-field focal acoustic waveforms from four histotripsy transducers used to compare the effects of frequency on histotripsy bubble expansion. Bubbles were generated by histotripsy pulses at 345 kHz, 500 kHz, 1.5 MHz, and 3 MHz. Note: waveforms shown above were measured at lower pressures that used in this study as outlined in the methods section.
For the experiments to study the cavitation bubble behavior generated by a dual-frequency beam, a transducer consisting both 500 kHz and 3 MHz elements was used to produce a combined 500 kHz and 3 MHz pulse as described in a previous study (Lin et al., 2014a). This pulse was generated by setting the arrival times for the 500 kHz and 3 MHz pulses to the point of maximal peak negative pressure overlap at the focus of the array transducer, with the combined peak negative pressure rising above the intrinsic threshold. Using this approach, bubble behavior was compared in samples treated with 500 kHz only, 3 MHz only, and a dual-frequency pulse with approximately equal half of the negative pressure generated from each frequency. Furthermore, the relative contribution of 500 kHz and 3 MHz was varied (while keeping the overall pressure constant) to demonstrate the ability to precisely control bubble expansion using this dual-frequency approach.
Optical Imaging
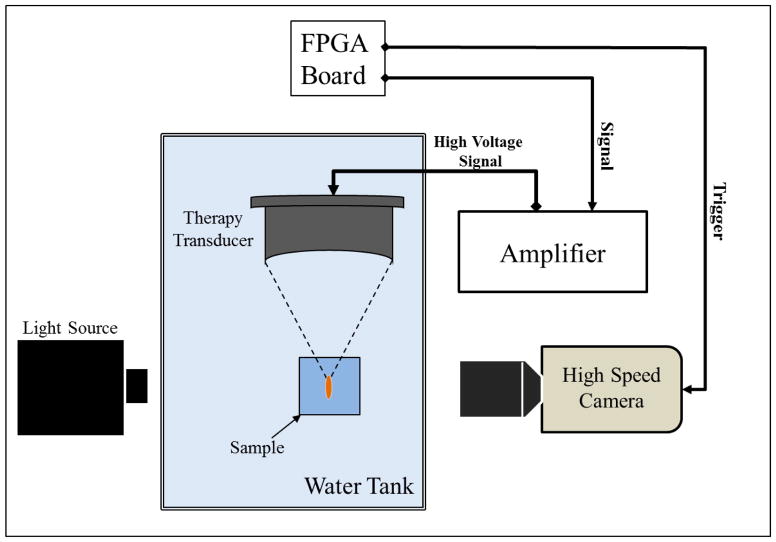
Optical images of the growth and collapse of individual bubbles were recorded by two high speed cameras (Fig. 2). For experiments with the 345 kHz and 1.5 MHz transducers, a high-speed, 1-megapixel CCD camera (Phantom V210, Vision Research, Wayne, NJ, USA) was aligned with the transducer and backlit by a continuous light source. The camera was focused using a macro-bellows lens (Tominon 1:4.5, F=105 mm; Kyocera, Kyoto, Japan), giving the captured images a resolution of approximately 5.9 μm and 3.4 μm per pixel for 345 kHz and 1.5 MHz, respectively. For experiments with the 500 kHz and 3 MHz dual frequency transducer, a digital, 1.3-megapixel CCD camera (PN: FL3-U3-13Y3M-C, Flea® 3, PointGrey, Richmond, BC, Canada) was positioned perpendicularly to the dual-frequency array transducer facing one of its optical windows. A Nikon 4X objective (MRP70040; Nikon, Chiyoda, Tokyo, Japan) was attached to the camera with extension tubes to magnify the image plane, giving the captured images a resolution of approximately 2.5 μm per pixel. A pulsed white-light LED (BXRA-50C9000-J-00, Bridgelux, Livermore, CA, USA) was placed on the diametrically-opposed optical window of the dual-frequency array transducer, which provided back-lit illumination.
Figure 2. Experimental setup.
The focus of histotripsy therapy transducers (345 kHz, 500 kHz, 1.5 MHz, and 3 MHz) was aligned inside agarose tissue phantoms of varied stiffness. Bubble expansion and collapse was monitored using high speed optical imaging. Note: different frequency transducers had different geometry and schematic is not drawn to scale.
Experimental Design
To study the effects of ultrasound frequency and tissue stiffness on histotripsy-induced bubble behavior, histotripsy bubbles were generated in degassed water (~20% O2) and agarose tissue phantoms with varied stiffness using 1–2 cycle histotripsy pulses at 345 kHz, 500 kHz, 1.5 MHz, 3 MHz, and the dual-frequency waveform (500 kHz and 3 MHz). Waveforms used at all frequencies had one high negative pressure phase with a peak negative pressure slightly greater than the histotripsy intrinsic threshold (Vlaisavljevich et al., 2014c). More specifically, the peak negative pressure, P(-)LS, used were 26.4 MPa (345 kHz), 26.3 MPa (500 kHz), 26.8 MPa (1.5 MHz), and 28.8 MPa (3 MHz). Due to the limited frame rate of the cameras, we could not image the bubble expansion and collapse during and after a single histotripsy pulse. Therefore, a series of time-delayed images of bubbles were used to reconstruct that average expansion and collapse behavior of the bubbles produced by identical histotripsy pulses. The specific delay times were varied based on the frequency and sample stiffness in order to reconstruct a sequence of bubble images covering the entire period of bubble expansion and collapse. For each sample at each time delay, the radius of bubbles produced by twenty identical histotripsy pulses was recorded. Each pulse was applied to a different point in the sample (2 mm spacing) to prevent the effects of cavitation damage from altering the tissue phantom mechanical properties. Shadowgraph images were converted from grayscale to binary by an intensity threshold determined by the background intensity using image processing software (MATLAB, The Mathworks, Natick, MA, USA). The size of single bubbles was measured for all twenty pulses to determine the bubble expansion radius, and the mean and standard deviation in bubble radius was calculated for each time delay. The calculated values for the bubble radius at each time delay were used to plot the average bubble radius as a function of time for all frequency and sample combinations. A sample size of 6 tissue phantoms was used for each agarose concentration.
Stress-Strain Estimation
Finite strains and stresses applied by the cavitation bubbles to the surrounding media for the different tissue phantoms and frequency combinations tested in this study were computed. The Green-Lagrange strain tensor and the maximum deviatoric stress in the theta-theta direction applied to the tissue at the bubble wall were estimated as
| (E6) |
| (E7) |
respectively, where R0 was 2.5 nm and Rmax was the maximum bubble radius measured for each condition experimentally (Fung, 1965; Gaudron et al., 2014). The estimated maximum strain and stress predicted from the measured bubble radius were plotted for each ultrasound frequency and tissue phantom stiffness.
Supra-threshold Bubble Behavior
To study the effects of increasing pressure on cavitation bubble behavior using pressure beyond the intrinsic threshold, bubbles were generated in degassed water (~20% O2) and agarose tissue phantoms with varied stiffness using histotripsy pulses at 345 kHz, 500 kHz, 1.5 MHz, and 3 MHz. Pulses were applied to samples at increasing P(-)LS above the histotripsy intrinsic threshold, and the resulting bubble cloud behavior was observed using a series of time-delayed optical images using the same method described above. For each experimental condition, images were analyzed to compare the size of the bubble cloud as well as the size of individual bubbles within the cloud.
Results
Bubble Behavior Simulation
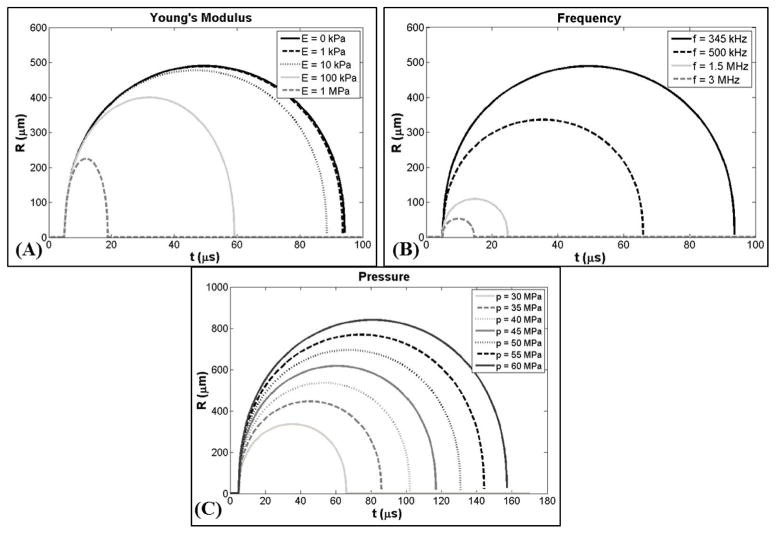
The effects of tissue stiffness and ultrasound frequency on histotripsy-induced bubble behavior were investigated using the numerical model described earlier. Results supported the hypothesis that increases in tissue stiffness cause a reduction in bubble expansion and collapse time. A plot showing the bubble radius vs. time (R-T) curve for a 2.5 nm initial bubble subjected to a 345 kHz pulse with peak negative pressure of 30 MPa (E1) demonstrated a decrease in bubble expansion as the Young’s modulus was varied from 0 kPa to 1 MPa (Fig. 3A). Following the passage of the pulse, the bubble rapidly expands, slows down as it reaches a maximum radius (Rmax), and collapses violently. Bubble growth was decreased for higher Young’s moduli as predicted due to this elastic property (“spring-like” behavior) increasing the isotropic stress on the bubble as it expands (Hua and Johnsen, 2013). Results showed only a small reduction in bubble expansion between Young’s moduli of 1 kPa to 10 kPa while larger decreases in bubble expansion were observed as Young’s moduli was increased to 100 kPa and 1 MPa. For example, for the 345 kHz condition shown in Figure 3A, Rmax at a Young’s modulus of 10 kPa was reduced by <3% compared to 1 kPa, while Rmax was reduced by ~18% at Young’s modulus of 100 kPa, and by ~54% at a Young’s modulus of 1 MPa. The time until maximum bubble expansion, tmax, and the time until bubble collapse, tc, were also observed to decrease with increasing Young’s modulus (Fig. 3A). For example, compared to 1 kPa, tmax decreased by ~6.5%, ~34%, and ~75% at 10kPa, 100kPa, and 1 MPa, respectively. Similarly, tc decreased by ~5.5%, ~37%, and ~80% at 10kPa, 100kPa, and 1 MPa, respectively, compared to a Young’s modulus of 1 kPa (Fig. 3A).
Figure 3. Bubble behavior simulation.
Plots show simulated bubble R-T curves for a 2.5 nm initial bubble subjected to histripsy pulses with varied Young’g modulus (E), frequency (f), and peak negative pressure (p-). (A) Young’s modulus was varied between 0kPa-1MPa (p-=30 MPa, f=345 kHz). (B) Frequency was compared for 345 kHz, 500 kHz, 1.5 MHz, and 3 MHz (p-=30 MPa, E=1 kPa). (C) p- was varied between 30MPa-60MPa (f=500 kHz, E=1 kPa). Results show an increase in bubble expansion with decreasing Young’s modulus (A), decreasing ultrasound frequency (B), and increasing pressure (C).
Results of the frequency simulation supported the hypothesis that decreasing frequency facilitates larger bubble expansion. A plot showing R-T curve for a 2.5 nm initial bubble subjected to histotripsy pulses with peak negative pressure of 30 MPa demonstrated an increase in bubble expansion as the pulse frequency (E1) was decreased from 3 MHz to 345 kHz (Fig. 3B). Decreases in frequency were shown to increase bubble expansion as the larger duration of the applied pressure at lower frequency increased the amount of energy imparted to the bubble and thus increased the resulting expansion. Results demonstrated that Rmax changed by approximately an order of magnitude as the frequency was changed from 345 kHz to 3 MHz. For example, compared to the Rmax at 345 kHz, the Rmax was reduced by ~31%, ~77%, and ~89% at 500kHz, 1.5 MHz, and 3 MHz, respectively (Fig. 3B). Results also showed similar decreases in both tmax and tc. For example, compared to 345 kHz, tmax decreased by ~30%, ~70%, and ~82% at 500kHz, 1.5 MHz, and 3 MHz, respectively. Similarly, tc decreased by ~30%, ~74%, and ~87% at 500kHz, 1.5 MHz, and 3 MHz, respectively, compared to 345 kHz (Fig. 3B).
In addition to the effects of tissue stiffness and ultrasound frequency, a final simulation was conducted to investigate the effects of peak negative pressure on bubble expansion. A plot showing the R-T curve for a 2.5 nm initial bubble subjected to a 500 kHz histotripsy pulse demonstrated a consistent increase in bubble expansion as the peak negative pressure was increased from 30 MPa to 60 MPa (Fig. 3C). Increases in the peak negative pressure resulted in larger bubbles due to the increased energy imparted into the bubble which acts to enhance bubble expansion. Results demonstrated a linear increase in Rmax from 335.9 μm for the 30 MPa pulse to 840.4 μm for the 60 MPa pulse at 500 kHz (Fig. 3C). Furthermore, results showed linear increases in both tmax and tc with increasing pressure (Fig. 3C).
Effects of Tissue Stiffness on Bubble Behavior
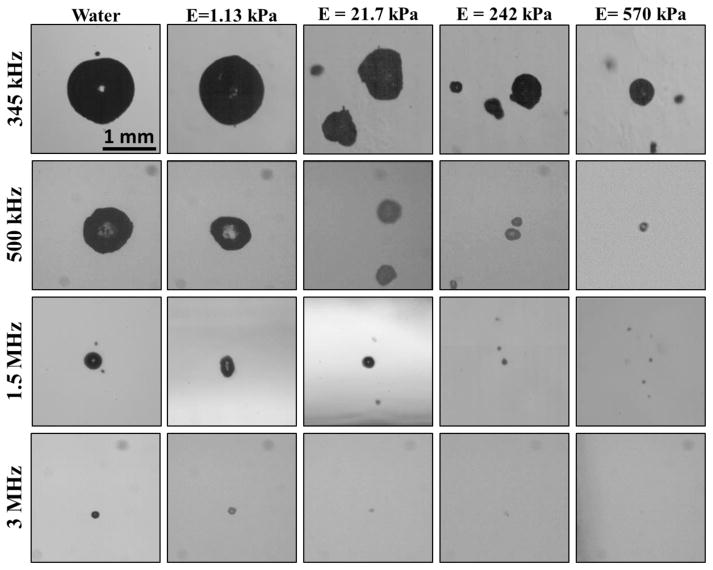
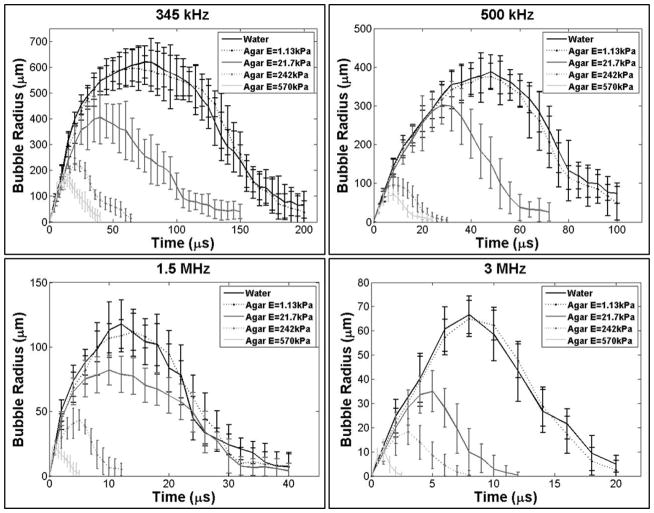
Experimental analysis demonstrated a significant decrease in bubble expansion as the tissue phantom stiffness was increased from a Young’s modulus of 1.13 kPa to a Young’s modulus of 570 kPa, with the trend being consistent for all four histotripsy frequencies (Fig. 4). For example, at 345 kHz, Rmax decreased by ~34%, ~64%, and ~73% in the 21.7 kPa, 242 kPa, and 570 kPa phantoms, respectively compared to the Rmax in the 1.13 kPa phantom (Fig. 5). The trend of decreasing bubble size with increasing stiffness was consistent for all frequencies tested (Table 2). To compare the effects of tissue stiffness independent of ultrasound frequency, Rmax in all tissue phantoms was normalized to Rmax at each frequency in water, demonstrating a consistent trend of decreasing Rmax with increasing stiffness (Fig. 6A). These results demonstrated a negligible decrease in Rmax for tissue phantoms with Young’s moduli of 1.13 kPa (compared to water) while the Rmax in the 21.7 kPa phantoms was decreased to 50–80% of the Rmax in water. Rmax was further reduced to <40% the size in water when the tissue phantom Young’s modulus was increased to 242 kPa, and <25% of the Rmax in water for 570 kPa phantoms.
Figure 4. Representative bubble images.
Optical images of bubbles produced by 345 kHz, 500 kHz, 1.5 MHz, and 3 MHz histotripsy pulses inside agarose tissue phantoms of increasing Young’s modulus taken at tmax. Results demonstrated a decrease in bubble size with increasing frequency and increasing tissue phantom stiffness.
Figure 5. Effects of phantom stiffness on bubble behavior.
Plots show the R-T curves for bubbles produced by 345 kHz, 500 kHz, 1.5 MHz, and 3 MHZ histotripsy pulses inside agarose tissue phantoms of increasing Young’s modulus. Results demonstrated a decrease in bubble expansion and collapse time for stiffer tissue phantoms at all frequencies.
Table 2. Results Table.
Table shows the Rmax, tmax, and tc values for all tissue phantom and frequency combinations. Results show a trend of decreasing Rmax, tmax, and tc with increase Young’s modulus and increasing frequency.
| Frequency | Material | Rmax (μm) | tmax (μs) | tc (μs) |
|---|---|---|---|---|
| 345 kHz | ||||
| Water | 617.2±61.8 | 75 | 200 | |
| E=1.13 kPa | 600.1±70.9 | 65 | 190 | |
| E=21.7 kPa | 398.8±102.5 | 40 | 150 | |
| E=242 kPa | 216.1±22.3 | 20 | 64 | |
| E=570 kPa | 163.9±37.2 | 12 | 40 | |
| 500 kHz | ||||
| Water | 387.9±43.9 | 48 | 100 | |
| E=1.13 kPa | 380.3±34.0 | 48 | 100 | |
| E=21.7 kPa | 297.4±50.5 | 28 | 72 | |
| E=242 kPa | 98.3±25.3 | 8.0 | 26 | |
| E=570 kPa | 71.8±15.1 | 8.0 | 24 | |
| 1.5 MHz | ||||
| Water | 114.1±18.9 | 12.0 | 36.0 | |
| E=1.13 kPa | 111.5±14.5 | 14.0 | 32.0 | |
| E=21.7 kPa | 79.5±11.5 | 10.0 | 32.0 | |
| E=242 kPa | 42.1±7.9 | 5.0 | 12 | |
| E=570 kPa | 20.6±4.1 | 1.0 | 5.0 | |
| 3 MHz | ||||
| Water | 64.8±7.9 | 8.0 | 20 | |
| E=1.13kPa | 65.2±7.0 | 8.0 | 18 | |
| E=21.7 kPa | 34.3±8.5 | 5.0 | 10 | |
| E=242 kPa | 18.0±5.3 | 3.0 | 7.0 | |
| E=570 kPa | 11.0±4.4 | 1.0 | 2.5 |
Figure 6. Relative changes in Rmax.
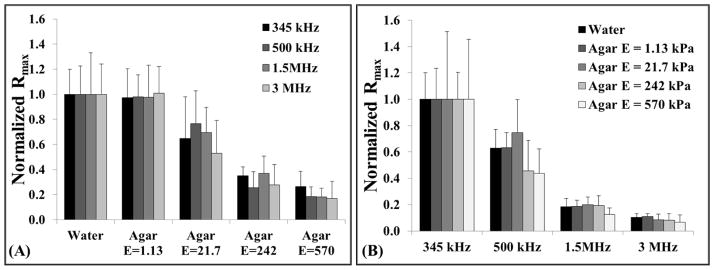
Graphs show the relative changes in Rmax for all tissue phantom and requency combinations investigated in this study. To compare the effects of Young’s modulus, Rmax values for all samples were normalized to the Rmax in water at each frequency. To compare the effects of frequency, Rmax was normalized to the Rmax in each sample for 345 kHz experiments. Results demonstrated a significant decrease in Rmax (p<0.05) with both increasing tissue stiffness (A) and increasing frequency (B). Statistical comparisons were made using a Student’s t-test with a Bonferroni correction.
The bubble lifespan was also decreased in tissue phantoms with increased Young’s modulus (Fig. 5). Both the time until maximum bubble expansion, tmax, and the time until bubble collapse, tc, were shown to decrease in tissue phantoms with increased Young’s modulus (Table 2). Due to the imaging resolution in this study, tc was defined as the time point at which the average bubble size reduced to <10% of the maximum bubble radius. It should be noted that the accuracy of the reported tmax and tc values was limited by the temporal resolution of these experiments and the method of averaging the behavior of many bubbles to reconstruct the R-T curves for each condition. The trends of decreasing tmax and tc for phantoms with increased Young’s modulus were observed for all frequencies tested (Fig. 5).
Effects of Ultrasound Frequency on Bubble Behavior
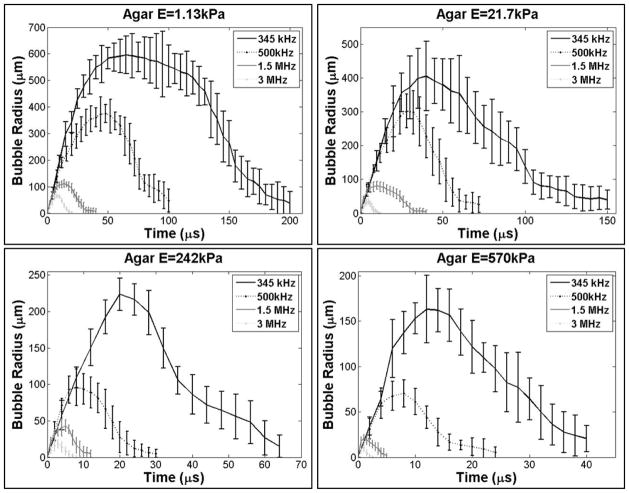
A significant decrease in bubble expansion was observed as the ultrasound frequency was increased from 345 kHz to 3 MHz, with the trend being consistent over the range of tested tissue phantom stiffness (Fig. 7). Rmax was highest at 345 kHz and decreased by approximately an order of magnitude as the frequency was increased to 3 MHz (Table 2). The trend of decreasing bubble size with increasing frequency was consistent for all tissue phantoms. To compare the effects of frequency independent of tissue stiffness, the Rmax in all samples was normalized to the Rmax at 345 kHz, demonstrating a consistent trend of decreasing bubble size with increasing frequency for the same tissue phantom elasticity (Fig. 6B). These results demonstrated a significant decrease in bubble size at 500 kHz with bubbles ~40–60% those seen at 345 kHz. Rmax was further reduced to ~20% and ~10% at frequencies of 1.5 MHz and 3 MHz, respectively.
Figure 7. Effects of ultrasound frequency on bubble behavior.
Plots show the R-T curves for bubbles produced inside tissue phantoms using 345 kHz, 500 kHz, 1.5 MHz, and 3 MHZ histotripsy pulses. Results demonstrated that increasing frequency resulted in decreased bubble expansion and collapse time in all samples.
The bubble lifespan was also decreased at higher frequency (Fig. 7). Both the time until maximum bubble expansion, tmax, and the time until bubble collapse, tc, were shown to decrease at higher frequency (Table 2). Interestingly, the observed values for tmax were similar at different frequencies when normalized to the period (1/f) at each frequency. For example, in the 1.13 kPa phantom, tmax in terms of periods was 22.4 periods, 24.0 periods, 21.0 periods, and 24.0 periods at 345 kHz, 500 kHz, 1.5 MHz, and 3 MHz, respectively. In terms of periods, tc was 69.0 periods, 50.0 periods, 48.0 periods, and 54.0 periods at 345 kHz, 500 kHz, 1.5 MHz, and 3 MHz, respectively, for the 1.13 kPa phantom. Similar trends of decreasing tmax and tc with increasing frequency were observed for all tissue phantoms tested (Fig. 7).
Estimated Stress-Strain
An estimate of the maximum strain (E6) and stress (E7) applied to the surrounding media was calculated based on the R-T curves for the different ultrasound frequency and tissue phantom stiffness combinations. Results demonstrated a decrease in the estimated maximum strain applied to the surrounding medium with both increasing stiffness and increasing frequency (Fig. 8A). For example, at 345 kHz, a change in Young’s modulus from 1.13 kPa to 570 kPa resulted in a >90% reduction in the estimated strain applied to the surrounding medium. A similar reduction in strain was observed with increasing frequency with a >98% reduction in the predicted strain applied to the 1.13 kPa phantom when the frequency was increased from 345 kHz to 3 MHz. Results for the estimated maximum stress showed a trend of decreasing stress with increasing frequency (Fig. 8B). For example, the predicted stress applied to the 570 kPa phantom at 3 MHz was <0.4% of the estimated stress at 345 kHz. Additionally, results for the estimated maximum stress showed a trend of increasing stress with increasing stiffness (Fig. 8B). For example, at 500 kHz the predicted stress applied to a 1.13 kPa phantom was <5% that applied to the 570 kPa phantom (Fig. 8B).
Figure 8. Estimated strain and stress.
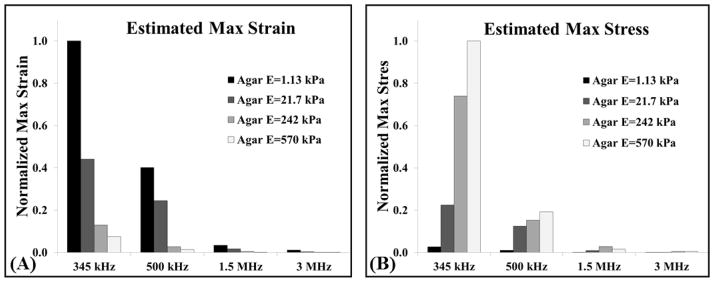
A stress-strain calculation was performed to predict the strain (E6) and stress (E7) applied by the bubbles to surrounding media with different elastic moduli tested in this study. (A) Results demonstrated a decrease in strain with both increasing Young’s modulus and frequency. (B) Stress analysis demonstrated a decrease in stress with increasing frequency, and an increase in stress at higher Young’s modulus.
Bubble Behavior Generated using Dual-Frequency Beam
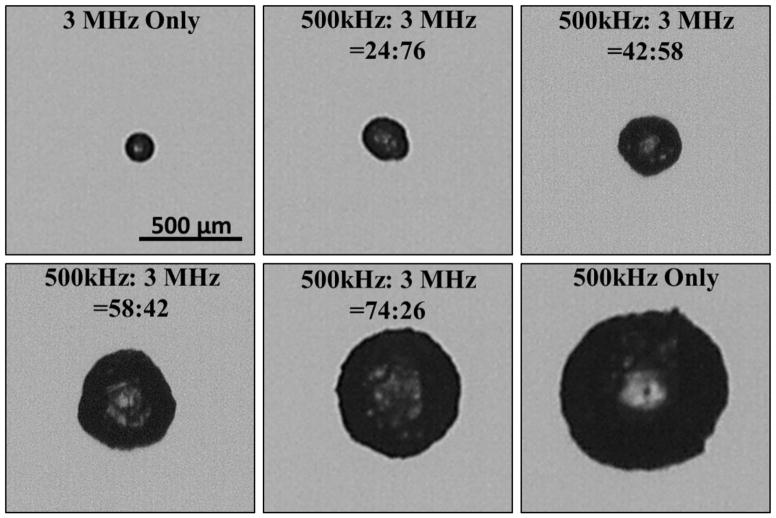
The bubble behavior generated by histotripsy transducers at 500 kHz, 3 MHz, and a combined dual-frequency (500 kHz and 3 MHz) was investigated. Results demonstrated the Rmax produced by a dual-frequency pulse with approximately 50% of the negative pressure from each frequency was between the Rmax of bubbles produced by the single frequency components at a similar total peak negative pressure (Fig. 9). The applied pressures for the individual frequencies of the combined waveform shown in Figure 9 were 14.3 MPa and 13.6 MPa for 500 kHz and 3 MHz, respectively, with a total P(-)LS of 27.9 MPa. The Rmax in degassed water for the combined waveform was 165.6±19.8 μm compared to 387.9±43.9 μm and 64.8±7.9 μm at 500 kHz and 3 MHz, respectively. This trend was also observed in all tissue phantoms.
Figure 9. Effects of using a dual-frequency waveform on bubble behavior.
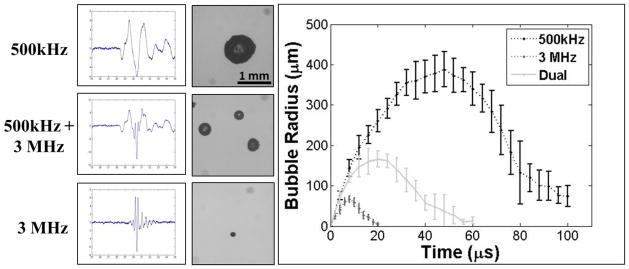
The ability to tailor bubble expansion using a previously developed dual-frequency approach was demonstrated using a 500 kHz and 3 MHz dual frequency transducer (Lin et al., 2014a). Images show example waveforms and the corresponding optical images of bubbles produced in degassed water using the 500 kHz (top), dual frequency (middle), and 3 MHz (bottom) transducers. Results demonstrated that the dual frequency bubbles grew to an intermediate size of 165.6±19.8 μm compared to 387.9±43.9 μm and 64.8±7.9 μm at 500 kHz and 3 MHz, respectively.
The ability to specifically tailor bubble size using this approach was demonstrated by varying the percentage of contribution from the respective frequencies (Fig. 10). Results showed a continual increase bubble expansion as the percentage of the p- amplitude from 500 kHz was increased and the contribution from 3 MHz was decreased. For example, in degassed water, Rmax was observed to decrease from 387.9±43.9 μm at 500 kHz only (500kHz:3MHz = 100:0) to 286.0±31.4 μm, 192.1±25.0 μm, 138.8±17.5 μm, 98.8±10.2 μm, and 64.8±7.9 when the ratio of 500kHz:3MHz was 74:26, 58:42, 42:58, 24:76, and 0:100, respectively (Fig. 10).
Figure 10. Effects of modulating relative amplitude of each frequency on bubble expansion using dual-frequency histotripsy.
Optical images of bubbles produced by the 500 kHz and 3 MHz dual frequency transducer with varied relative amplitude for the 500 kHz and 3 MHz components. Results demonstrated an increase in bubble size as the percentage of amplitude applied by the 500 kHz elements was increased.
Supra-threshold Bubble Behavior
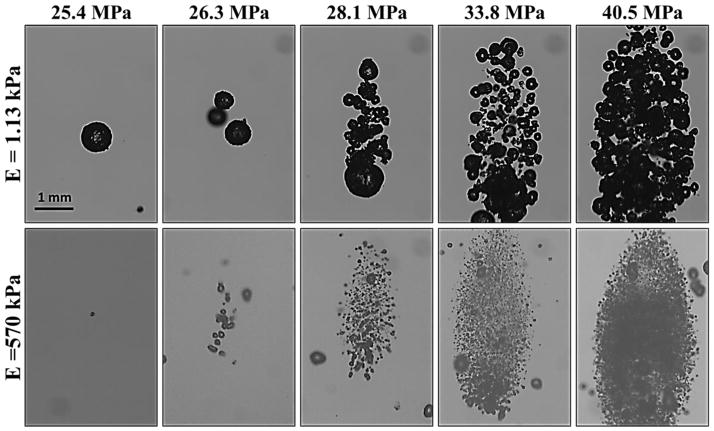
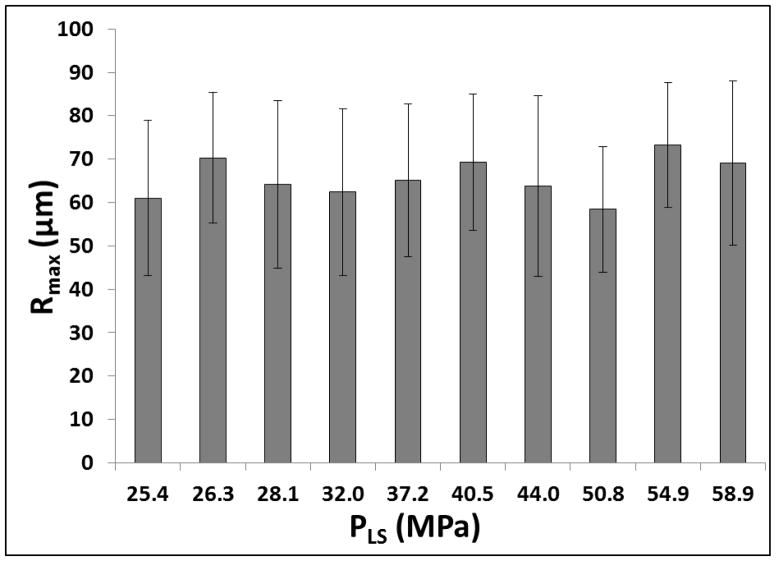
To test the effects of increasing pressure on bubble behavior, experiments were repeated for histotripsy pulses with P(-)LS increasing above the intrinsic threshold. As P(-)LS was increased, results demonstrated a consistent increase in the overall size of the bubble cloud matching the portion of the beam profile above the intrinsic threshold, as has been previously observed (Lin et al., 2014a; Lin et al., 2014b) (Fig. 11). However, although the size of the bubble cloud increased with increasing P(-)LS, the Rmax for individual bubbles within the cloud was not observed to significantly change (Fig. 11). Furthermore, the size of individual bubbles was observed to be nearly uniform throughout the bubble cloud, although some larger bubbles were observed at the edges of the cloud in the weaker phantoms, potentially due to bubble coalescence (Fig. 11). For all frequencies and tissue phantom combinations tested, no significant difference in Rmax was observed with increasing P(-)LS for individual bubbles that could be identified within the cloud. For example, Figure 11 shows images of bubble clouds produced in tissue phantoms with Young’s moduli of 1.13 kPa and 570 kPa using the 500 kHz histotripsy transducer at increasing P(-)LS. As P(-)LS was increased, the size of the bubble cloud increased while no significant difference in Rmax was observed. It should be noted that only the bubbles that could be individually identified and were not overlapping with adjacent bubbles were included in this analysis. Reconstructing the R-T curves for individual bubbles within the cloud was more difficult at higher P(-)LS levels due to the density of bubbles within the cloud, especially in water and tissue phantoms with low Young’s moduli, due to bubble overlapping or coalescence. However, the Rmax of bubbles that could be individually identified within the cloud showed no significant difference compared to bubbles produced at P(-)LS directly above the intrinsic threshold. Due to the reduced bubble expansion for the higher stiffness phantoms and higher ultrasound frequencies, more bubbles remained separate from one another within the cloud, allowing the bubble R-T curves to be quantified for bubbles within the cloud. For example, Figure 12 shows the Rmax for bubbles produced by the 500 kHz transducer in the 570 kPa tissue phantoms at P(-)LS values ranging from 25.4 MPa to 58.9 MPa. Despite the >30 MPa increase in P(-)LS, no significant difference in Rmax was observed (p>0.05) (Fig. 12).
Figure 11. Effects of increasing P(-)LS on bubble cloud behavior.
Optical images show bubble clouds formed from the 500 kHz transducer at P(-)LS values between 25.4–40.5 MPa in tissue phantoms with Young’s moduli of 1.13 kPa (top) and 570 kPa (bottom). Results demonstrated an increase in the size of the bubble cloud with increasing pressure. However, no significant change in the size of individual bubbles within the clouds was observed with increasing P(-)LS.
Figure 12. Effects of increasing P(-)LS on Rmax.
Plot shows Rmax for bubbles formed by the 500 kHz histotripsy transducer in the 570 kPa phantom at P(-)LS values ranging from 25.4 MPa to 58.9 MPa. No significant change in Rmax was observed for individual bubbles within the clouds with increasing P(-)LS (p>0.05).
Discussion
The first part of this work investigated the effects of increased stiffness on the behavior of histotripsy bubbles produced using the intrinsic threshold mechanism. In a separate study, the intrinsic threshold was shown to be independent of tissue stiffness and frequency due to the dominance of surface tension in determining the inertial cavitation threshold of the nanometer-sized cavitation nuclei (Vlaisavljevich et al., 2014c). In contrast, the numerical simulation in this study demonstrated that the subsequent expansion and collapse of the cavitation bubbles are affected by the elastic properties of the medium. Increases in Young’s modulus resulted in a significant reduction in bubble expansion. Experimental results validated this trend with controlled increases in phantom stiffness consistently resulting in significant decreases in Rmax. For all frequencies, the Rmax in the stiffest tissue phantoms (E=570 kPa) was <25% the size of the Rmax in the weakest phantoms (E=1.13 kPa). These results help explain the previous finding that stiffer tissues are more resistant to histotripsy-induced tissue damage, which was hypothesized to be due to reduced strain applied to tissues as a result of impeded bubble expansion (Vlaisavljevich et al., 2014c; Vlaisavljevich et al., 2013b). This hypothesis was further assessed by computing the predicted stresses and strains at the bubble wall at maximum expansion. These measurements demonstrated that the observed decreases in bubble expansion would result in a decrease in the strain applied to surrounding stiffer tissues. Despite the decreases in bubble expansion, higher stresses were predicted for stiffer tissues as a result of the higher Young’s moduli. Previous work found that tissues resistant to histotripsy had higher ultimate stresses and Young’s moduli, but similar (and often lower) ultimate strains, compared to tissues that could be completely fractionated (Vlaisavljevich et al., 2014a). This finding suggests that stiffer tissues are able to withstand the increased stress predicted in this study, while a likely limiting factor to achieving tissue fractionation is the ability to expand bubbles to a sufficient size in which the applied strain rises above the ultimate strain of the tissue. Overall, the theoretical and experimental results support our hypothesis that increases in tissue stiffness lead to decreased bubble expansion and reduced strain to surrounding tissue, leading to increased damage resistance for stiffer tissues treated with histotripsy.
In addition to the effects of tissue stiffness, the role of ultrasound frequency was also investigated. Results from the numerical simulation demonstrated that bubble expansion was dependent upon the duration of the rarefactional phase, with lower frequency resulting in increased bubble expansion. These results were validated by experiments in tissue phantoms demonstrating an approximately order of magnitude decrease in Rmax when the frequency was increased from 345 kHz to 3 MHz. At lower frequency, bubble expansion was increased due to more energy being imparted into the bubble as a result of the increased duration of the applied rarefactional pressure. It is interesting to note that the bubble lifespan, when normalized to the period (1/f) is almost constant across different frequencies. Overall, these findings suggest that, although bubble expansion is impeded in stiffer tissues, lower frequency may be used to enhance bubble expansion for the fractionation of stiffer tissues. This hypothesis was supported by the stress-strain calculations which predicted an increase in both the stress and strain applied to tissues at lower frequency.
In the final part of this work, the effects of pressure on bubble expansion were investigated. Results of the simulation predicted that increasing pressure would result in a corresponding increase in bubble expansion. However, the predicted increases in individual bubble size were not observed in experiments. Instead, as P(-)LS was increased, the size of individual bubbles within the focal region appeared to remain constant. Although the overall size of the bubble cloud increased with increasing P(-)LS, the bubbles within the cloud appeared to be of uniform size approximately matching the size of the individual bubbles measured at P(-)LS directly above the intrinsic threshold. This finding may suggest that the individual bubbles formed throughout the entire focal region actually experience the intrinsic threshold pressure rather than a higher pressure as predicted by the linear summation. This possibility is supported by the observation that bubbles in the center of the cloud did not grow larger than peripheral bubbles. We hypothesize that the propagating acoustic wave loses energy into the bubbles when cavitation is generated. This effect has been previously observed in shock wave lithotripsy where a decrease in peak negative pressure has been measured when cavitation bubbles are generated (Fung, 1965; Pishchalnikov et al., 2008). In this process, the ultrasound beams constructively interfere with one another as they propagate towards the focal region until the peak negative pressure reaches the intrinsic threshold. Once the intrinsic threshold is reached, a cavitation bubble is generated, and the pressure drops below the intrinsic threshold for a short distance as the beams continue to propagate until intrinsic threshold is reached once again, with this process repeating through the entire focal volume. As a result of this process of transferring energy into the forming bubbles, the constructive interference needed to reach pressure beyond the intrinsic threshold at the focus does not occur.
In addition to explaining the bubble behavior observed in this study, the proposed process of bubble-induced pressure saturation also suggests that some caution should be taken when reporting the peak negative pressure levels achieved in histotripsy therapy. Although the pressure estimated from the linear summation of individual elements has shown good agreement up to 30 MPa with the p- measured directly in a higher cavitation threshold medium, 1,3 butanediol, in a previous study (Maxwell et al., 2013), the results of this work suggest that the actual pressure achieved at the focus may be limited to the intrinsic threshold of the medium. In reality, pressures exceeding the intrinsic threshold may not occur when cavitation is generated. As such, it is perhaps better to report the applied pressure as a “potential peak negative pressure” measured from the linear summation. Another metric that may be useful to report may be the dimensions of the focal region that exceeds the intrinsic threshold, as this dimension consistently matches the size and location of the cavitation cloud that is generated as well as the resulting histotripsy lesion (Lin et al., 2014b). However, it is important to note that this process of bubble-induced pressure saturation is only one potential explanation for the observation that Rmax did not increase at higher P(-)LS. Another possible explanation is that bubble-bubble interactions within the cloud act to limit the expansion of adjacent bubbles, an effect which wasn’t accounted for in the single bubble simulations used in the study. Future work will aim to investigate these different possibilities both experimentally and theoretically by developing relevant multi-bubble models.
Overall, the results of this study improve our understanding of the histotripsy process and will help to improve parameter optimization for histotripsy treatments of specific tissues. For example, the finding that increasing P(-)LS above the intrinsic threshold increases the size of the bubble cloud but does not change the size of individual bubbles inside the focus suggests that alternative strategies such as decreasing frequency will be required to enhance bubble expansion. The results of this study demonstrate that bubble size is dictated by the waveform characteristics at the intrinsic threshold. As a result, bubble size can be predictably manipulated by changing the waveform parameters. This ability to tailor bubble expansion was demonstrated in this study using a dual-frequency approached previously developed by Lin et al (Lin et al., 2014a). This approach allows for the size of bubbles produced by a single transducer to be quickly modulated by adjusting the relative proportion of the peak negative pressure produced by each of the two frequencies. Based on a specific clinical application, this dual-frequency approach could be used to design optimal pulsing strategies. For example, there is a tradeoff between using higher frequency to increase precision due to the smaller focal zone compared to using lower frequency to enhance bubble expansion. The dual-frequency approach also has the potential to improve the effectiveness of a selective ablation strategy that has previously been developed in which softer tissues are fractionated while surrounding stiffer tissues such as vital blood vessels inside the focal volume remain intact (Vlaisavljevich et al., 2014a; Vlaisavljevich et al., 2013b). By optimizing the waveform so that bubble expansion is large enough to fractionate the softer tissue but not the stiffer tissue, the risk of fractionating the stiffer vital tissue will be further reduced.
Conclusion
In this study, the effects of tissue stiffness and ultrasound parameters on histotripsy-induced cavitation bubble behavior were investigated. The results demonstrate that increasing tissue phantom stiffness results in a significant decrease in bubble expansion and collapse time, helping to explain previous findings that stiffer tissues are more resistant to histotripsy-induced tissue damage. It was also shown that decreasing ultrasound frequency facilitates bubble expansion, suggesting that lower frequency may potentially be more effective at fractionating stiffer tissues using histotripsy. Experimental results further showed that increasing P(-)LS resulted in a larger bubble cloud, but did not increase the expansion of individual bubbles within the cloud, potentially due to bubble-induced pressure saturation at the intrinsic threshold or due to bubble-bubble interactions within the cloud.. Finally, this work demonstrated the potential of using a previously developed dual-frequency strategy to modulate the expansion of histotripsy bubbles. Overall, the results of this study improve our understanding of how tissue stiffness and ultrasound parameters affect the histotripsy bubble cloud behavior and provide a rational basis to tailor acoustic parameters for treatment of the specific tissues of interest.
Acknowledgments
This material is based upon work supported by the National Science Foundation Graduate Research Fellowship. This work was supported by grants from National Institute of Biomedical Imaging And Bioengineering (NIBIB) of the National Institutes of Health under Award Number R01EB008998, a Research Scholar Grant from the American Cancer Society (RSG-13-101-01-CCE), a National Science Foundation Grant (CBET 1253157), the National Institutes of Health under Award Number R01HL110990, The Hartwell Foundation, and Focused Ultrasound Foundation. Disclosure notice: Drs. Charles A. Cain and Zhen Xu have financial interests and/or other relationship with HistoSonics Inc.
References
- Allen JS, Roy RA. Dynamics of gas bubbles in viscoelastic fluids. I. Linear viscoelasticity. J Acoust Soc Am. 2000a;107:3167–78. doi: 10.1121/1.429344. [DOI] [PubMed] [Google Scholar]
- Allen JS, Roy RA. Dynamics of gas bubbles in viscoelastic fluids. II. Nonlinear viscoelasticity. J Acoust Soc Am. 2000b;108:1640–50. doi: 10.1121/1.1289361. [DOI] [PubMed] [Google Scholar]
- Balgude AP, Yu X, Szymanski A, Bellamkonda RV. Agarose gel stiffness determines rate of DRG neurite extension in 3D cultures. Biomaterials. 2001;22:1077–84. doi: 10.1016/s0142-9612(00)00350-1. [DOI] [PubMed] [Google Scholar]
- Freund JB. Suppression of shocked-bubble expansion due to tissue confinement with application to shock-wave lithotripsy. J Acoust Soc Am. 2008;123:2867–74. doi: 10.1121/1.2902171. [DOI] [PMC free article] [PubMed] [Google Scholar]
- Fung YC. Foundations of solid mechanics. Englewood Cliffs, N.J: Prentice-Hall; 1965. [Google Scholar]
- Gaudron R, Warnez M, Johnsen E. Bubble dynamics in a viscoelastic medium with nonlinear elasticity. 2014;2014 submitted. [submitted] [Google Scholar]
- Hall TL, Kieran K, Ives K, Fowlkes JB, Cain CA, Roberts WW. Histotripsy of rabbit renal tissue in vivo: temporal histologic trends. J Endourol. 2007;21:1159–66. doi: 10.1089/end.2007.9915. [DOI] [PubMed] [Google Scholar]
- Hua CY, Johnsen E. Nonlinear oscillations following the Rayleigh collapse of a gas bubble in a linear viscoelastic (tissue-like) medium. Physics of Fluids. 2013:25. [Google Scholar]
- Jimenez-Fernandez J, Crespo A. Bubble oscillation and inertial cavitation in viscoelastic fluids. Ultrasonics. 2005;43:643–51. doi: 10.1016/j.ultras.2005.03.010. [DOI] [PubMed] [Google Scholar]
- Lin KW, Duryea AP, Kim Y, Hall TL, Xu Z, Cain CA. Dual-beam histotripsy: a low-frequency pump enabling a high-frequency probe for precise lesion formation. IEEE Trans Ultrason Ferroelectr Freq Control. 2014a;61:325–40. doi: 10.1109/TUFFC.2014.6722617. [DOI] [PMC free article] [PubMed] [Google Scholar]
- Lin KW, Kim Y, Maxwell AD, Wang TY, Hall TL, Xu Z, Fowlkes JB, Cain CA. Histotripsy beyond the intrinsic cavitation threshold using very short ultrasound pulses: microtripsy. IEEE Trans Ultrason Ferroelectr Freq Control. 2014b;61:251–65. doi: 10.1109/TUFFC.2014.6722611. [DOI] [PMC free article] [PubMed] [Google Scholar]
- Maxwell AD, Cain CA, Fowlkes JB, Xu Z. Inception of Cavitation Clouds by Scattered Shockwaves. IEEE Ultrasonics Symposium. 2010;3B-2 [Google Scholar]
- Maxwell AD, Cain CA, Hall TL, Fowlkes JB, Xu Z. Probability of cavitation for single ultrasound pulses applied to tissues and tissue-mimicking materials. Ultrasound Med Biol. 2013;39:449–65. doi: 10.1016/j.ultrasmedbio.2012.09.004. [DOI] [PMC free article] [PubMed] [Google Scholar]
- Maxwell AD, Wang TY, Cain CA, Fowlkes JB, Sapozhnikov OA, Bailey MR, Xu Z. Cavitation clouds created by shock scattering from bubbles during histotripsy. J Acoust Soc Am. 2011;130:1888–98. doi: 10.1121/1.3625239. [DOI] [PMC free article] [PubMed] [Google Scholar]
- Parsons JE, Cain CA, Abrams GD, Fowlkes JB. Pulsed cavitational ultrasound therapy for controlled tissue homogenization. Ultrasound Med Biol. 2006a;32:115–29. doi: 10.1016/j.ultrasmedbio.2005.09.005. [DOI] [PubMed] [Google Scholar]
- Parsons JE, Cain CA, Fowlkes JB. Cost-effective assembly of a basic fiber-optic hydrophone for measurement of high-amplitude therapeutic ultrasound fields. J Acoust Soc Am. 2006b;119:1432–40. doi: 10.1121/1.2166708. [DOI] [PubMed] [Google Scholar]
- Pishchalnikov YA, McAteer JA, Williams JC., Jr Effect of firing rate on the performance of shock wave lithotriptors. BJU Int. 2008;102:1681–6. doi: 10.1111/j.1464-410X.2008.07896.x. [DOI] [PMC free article] [PubMed] [Google Scholar]
- Roberts WW, Hall TL, Ives K, Wolf JS, Jr, Fowlkes JB, Cain CA. Pulsed cavitational ultrasound: a noninvasive technology for controlled tissue ablation (histotripsy) in the rabbit kidney. J Urol. 2006;175:734–8. doi: 10.1016/S0022-5347(05)00141-2. [DOI] [PubMed] [Google Scholar]
- Ulrich TA, Jain A, Tanner K, MacKay JL, Kumar S. Probing cellular mechanobiology in three-dimensional culture with collagen-agarose matrices. Biomaterials. 2010;31:1875–84. doi: 10.1016/j.biomaterials.2009.10.047. [DOI] [PubMed] [Google Scholar]
- Vlaisavljevich E, Durmaz YY, Maxwell A, ElSayed M, Xu Z. Nanodroplet-Mediated Histotripsy for Image-guided Targeted Ultrasound Cell Ablation. Theranostics. 2013a;3:851–64. doi: 10.7150/thno.6717. [DOI] [PMC free article] [PubMed] [Google Scholar]
- Vlaisavljevich E, Kim Y, Allen S, Owens G, Pelletier S, Cain C, Ives K, Xu Z. Image-guided non-invasive ultrasound liver ablation using histotripsy: feasibility study in an in vivo porcine model. Ultrasound Med Biol. 2013b;39:1398–409. doi: 10.1016/j.ultrasmedbio.2013.02.005. [DOI] [PMC free article] [PubMed] [Google Scholar]
- Vlaisavljevich E, Kim Y, Owens G, Roberts W, Cain C, Xu Z. Effects of tissue mechanical properties on susceptibility to histotripsy-induced tissue damage. Phys Med Biol. 2014a;59:253–70. doi: 10.1088/0031-9155/59/2/253. [DOI] [PMC free article] [PubMed] [Google Scholar]
- Vlaisavljevich E, Maxwell A, Warnez M, Johnsen E, Cain CA, Xu Z. Histotripsy-induced cavitation cloud initiation thresholds in tissues of different mechanical properties. IEEE Trans Ultrason Ferroelectr Freq Control. 2014b;61:341–52. doi: 10.1109/TUFFC.2014.6722618. [DOI] [PMC free article] [PubMed] [Google Scholar]
- Vlaisavljevich E, Warnez M, Johnsen E, Cain C, Lin KW, Maxwell A, Fowlkes JB, Xu Z. Effects of Ultrasound Frequency and Tissue Stiffness on the Histotripsy Intrinsic Threshold for Cavitation. 2014c. In Submission. [DOI] [PMC free article] [PubMed] [Google Scholar]
- Warnez M, Johnsen E. The effect of relaxation time on cavitation dynamics in viscoelastic media: A numerical investigation of growth and forced oscillations. 2014. [In Preparation] [Google Scholar]
- Xu Z, Fowlkes JB, Ludomirsky A, Cain CA. Investigation of intensity thresholds for ultrasound tissue erosion. Ultrasound Med Biol. 2005;31:1673–82. doi: 10.1016/j.ultrasmedbio.2005.07.016. [DOI] [PMC free article] [PubMed] [Google Scholar]
- Xu Z, Raghavan M, Hall TL, Chang CW, Mycek MA, Fowlkes JB, Cain CA. High speed imaging of bubble clouds generated in pulsed ultrasound cavitational therapy--histotripsy. IEEE Trans Ultrason Ferroelectr Freq Control. 2007;54:2091–101. doi: 10.1109/TUFFC.2007.504. [DOI] [PMC free article] [PubMed] [Google Scholar]
- Yang X, Church CC. A model for the dynamics of gas bubbles in soft tissue. J Acoust Soc Am. 2005;118:3595–606. doi: 10.1121/1.2118307. [DOI] [PubMed] [Google Scholar]
- Zabolotskaya EA, Ilinskii YA, Meegan GD, Hamilton MF. Modifications of the equation for gas bubble dynamics in a soft elastic medium. J Acoust Soc Am. 2005;118:2173–81. doi: 10.1121/1.2010348. [DOI] [PubMed] [Google Scholar]


