
Figure 6. Relative changes in Rmax.
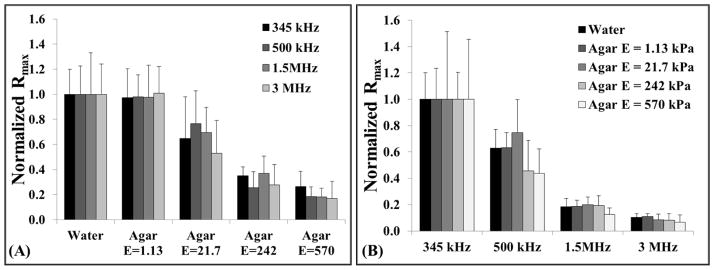
Graphs show the relative changes in Rmax for all tissue phantom and requency combinations investigated in this study. To compare the effects of Young’s modulus, Rmax values for all samples were normalized to the Rmax in water at each frequency. To compare the effects of frequency, Rmax was normalized to the Rmax in each sample for 345 kHz experiments. Results demonstrated a significant decrease in Rmax (p<0.05) with both increasing tissue stiffness (A) and increasing frequency (B). Statistical comparisons were made using a Student’s t-test with a Bonferroni correction.