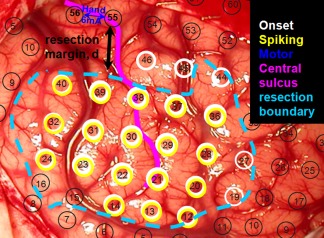
Figure 1.

An example of ESM to determine epileptogenic zone (cyan), finger area (blue), and resection margin, d (black). Black circles indicate an array of subdural electrodes placed on the brain. [Color figure can be viewed in the online issue, which is available at http://wileyonlinelibrary.com.]
