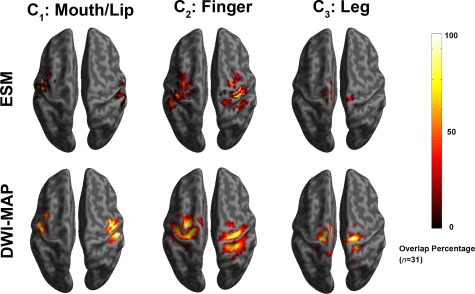
Figure 3.

Comparison of overlap percentage maps obtained from ESM (top) and DWI‐MAP classification (bottom) in children with epilepsy (n = 31). Both ESM and DWI‐MAP of individual subjects were spatially transferred into standard MNI space and overlapped across subjects. Color bar indicates the overlap percentage of all cortical localizations obtained by each modality. [Color figure can be viewed in the online issue, which is available at http://wileyonlinelibrary.com.]
