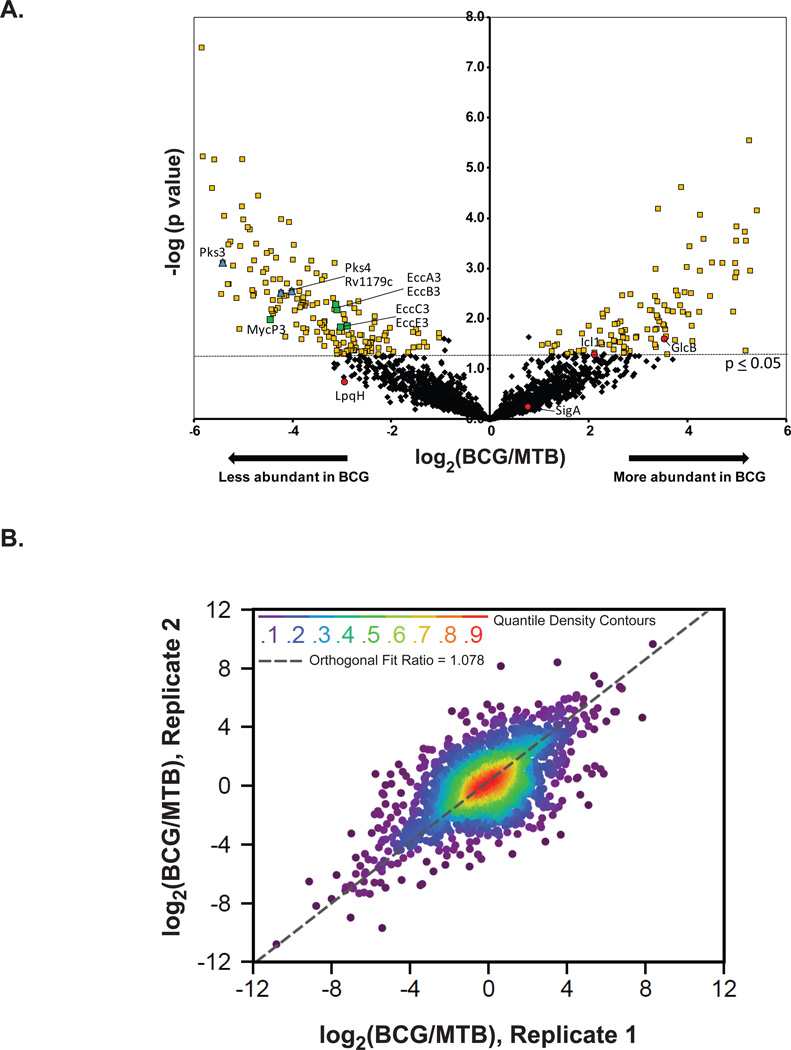
Figure 4. Label-free quantification of proteins from M. tuberculosis (MTB) and M. bovis BCG.
(A) To identify proteins with differences in abundance between the membranes of MTB and BCG, a label-free quantification analysis based on peak area was performed. The measured area under the curve of m/z and retention time aligned extracted ion chromatogram of each peptide was performed via the label-free quantitation module found in MaxQuant [ver. 1.2.2.5]. We obtained relative abundance ratios for 2,203 proteins (black diamonds), shown here plotted by BCG/MTB ratio (log2 scale) and pvalue (−log10 scale). Of these shared proteins, 294 were statistically different (p≤0.05, t-test) in abundance between strains by 2-fold or more yellow squares). Proteins with LFQ ratios confirmed by immunoblot are shown as red circles (SigA-levels unchanged) and (LpqH-lower level in BCG, albeit not significant). Also labeled are proteins under-represented in the BCG that correspond to PAT synthesis (blue diamonds) and the ESX-3 secretion system (green squares). (B) The correlation between log2 (BGG/MTB) ratios obtained from two biological replicates of MTB and BCG. Nonparemetric quantile densities are shown between the two replicates with an orthogonal fit

