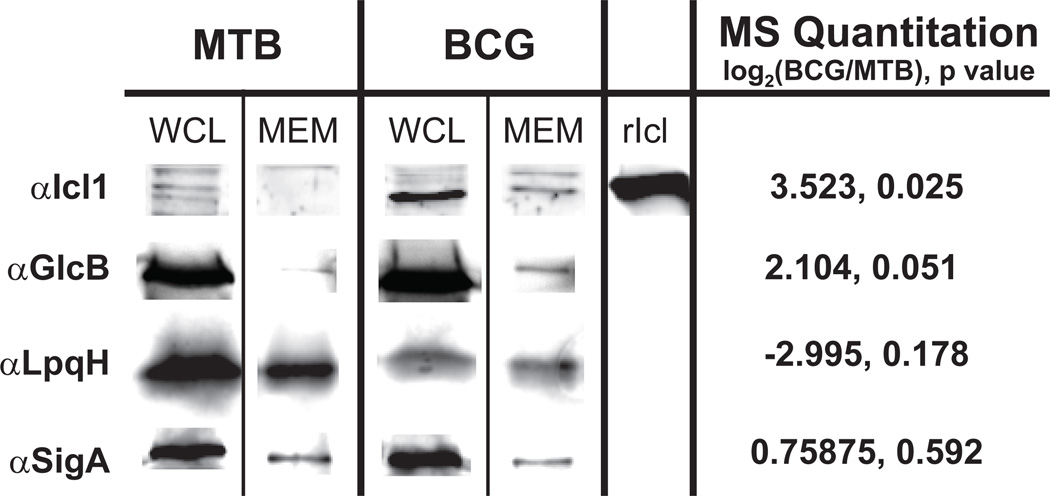
Figure 6. Immunoblot confirmation of relative protein abundances between the M. tuberculosis H37Rv and M. bovis BCG membrane fractions.
The same membrane fractions (MEM) used for MS analysis were also analyzed by immunoblot using antibodies against four representative proteins. Also included are the whole cell lysates (WCL) from which the corresponding membrane fractions were derived. The isocitrate lysase Icl1 and malate synthase GlcB represent proteins that were significantly reduced in the BCG membrane as determined by our MS analysis. The sigma factor SigA produced a label-free quantitation log2(BCG/MTB) ratio of 0.759 with a p value of 0.555, indicating no difference in abundance between the strains. The LpqH lipoprotein was determined to be lower in abundance in the BCG membrane than MTB (−2.995) albeit with a p value of 0.178.

