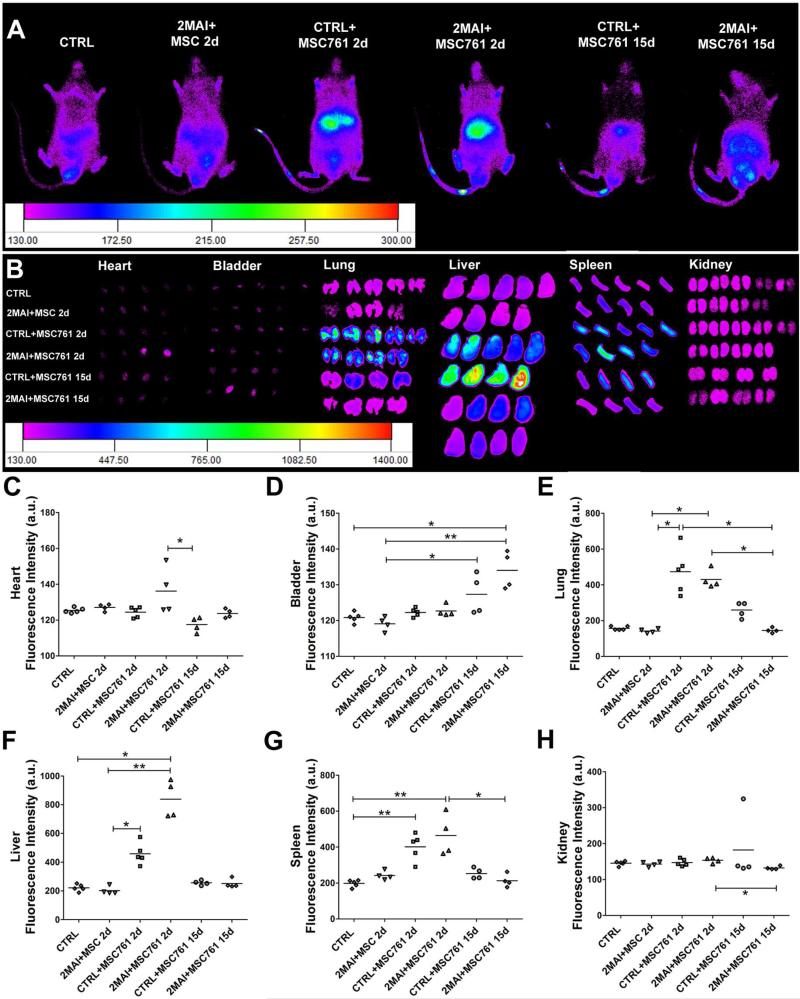
Figure 3. Tracking of X-Sight-labeled MSCs at 2 or 15 days after cell transplantation.
The cells were intravenously injected in control and chagasic animals 2 months after infection and then tracked by IVIS 2 or 15 days after cell injection. (A) Representative images showing the distribution of transplanted MSCs viewed from the ventral surface of the body. (B) Images of ex vivo organs showing the distribution of labeled MSCs. (C-H) Quantification of fluorescence intensity of ex vivo organs shown in images in B. The evaluated organs were (C) heart, (D) bladder, (E) lung, (F) liver, (G) spleen and (H) kidney. Group abbreviations: CTRL-control mice; 2MAI-2 months after infection; +MSC761 2d or 15d-plus X-Sight 761-labeled MSC after 2 or 15 days of the transplantation, respectively. *P<0.05 and **P<0.01.

