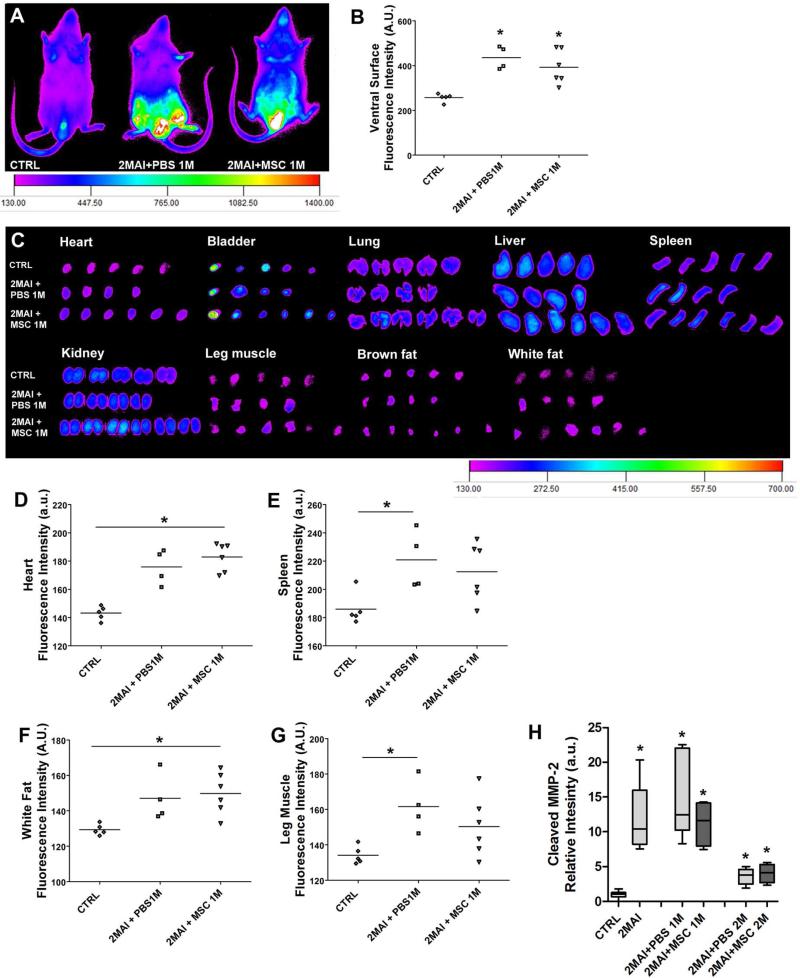
Figure 5. Quantification of global MMP activity.
The mice received a tail vein injection of MMPSense750 48 hours before the imaging to detect MMP activity. Whole body and organ images from control and chagasic mice treated or not with MSCs were obtained by IVIS 1 month after PBS or cell treatment. (A) Representative images showing the distribution of MMPSense750 viewed from in the ventral surface of the body. (B) Quantification of whole body fluorescence intensity. (C ) Representative images showing MMP activity in selected ex vivo organs. (D-G) Quantification of fluorescence intensity of ex vivo organs. The analyzed organs were heart, bladder, lung, liver, spleen, kidney, leg muscle, brown fat and white fat. However only the graphs that present significant statistical differences are shown, which were (D) heart, (E) spleen, (F) white fat and (G) leg muscle. (H) Western blot of heart sample for cleaved MMP-2 protein. Group abbreviations: CTRL-control mice; 2MAI-2 months after infection; +PBS 1M or 2M-plus 1 or 2 months after PBS treatment; +MSC 1M or 2M-plus 1 or 2 months after MSC therapy.

