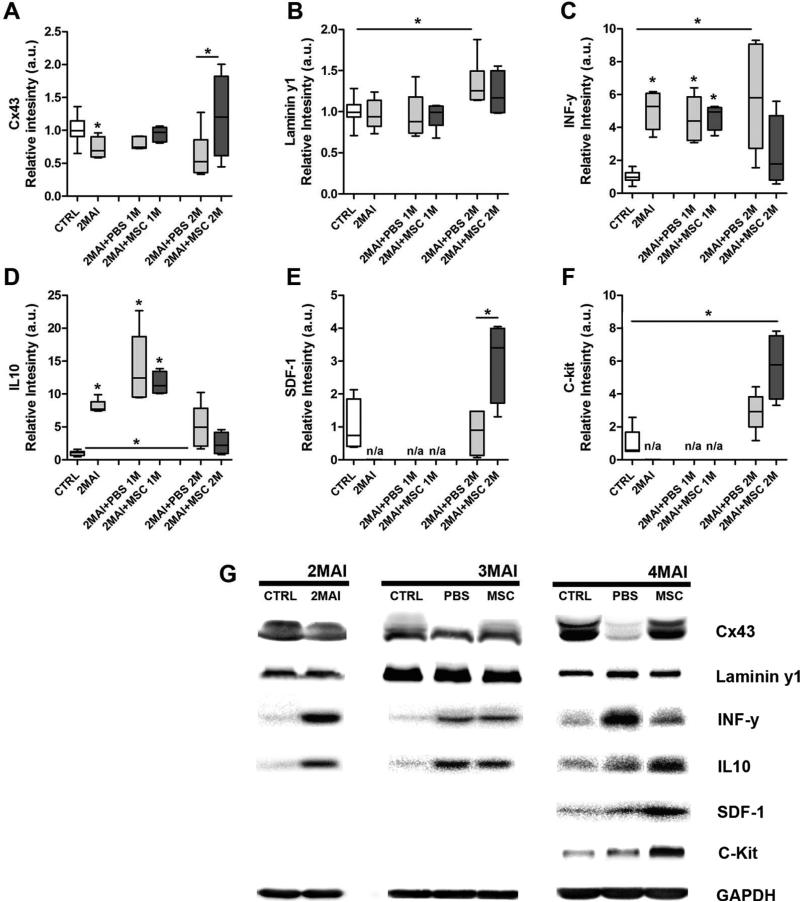
Figure 6. Western blot analysis of selected proteins in the heart of T. cruzi infected mice.
The evaluated proteins included IL-10; IL-1β; INF-γ; Cx43; Cx37; occludin; laminin γ-1; ET-1; SDF-1; Stat-1; c-Kit; iNOS; cTnT; dystrophin and caveolin 3 but only the graphs which present statistical differences after MSC therapy are shown, including (A) Cx43 (although total Cx43 is shown, similar changes were observed in the phospho- and dephosphorylated isoforms, not illustrated), (B) laminin γ1, (C) INF-γ, (D) IL-10, (E) SDF-1 and (F) c-kit. (G) Representative images of the western blot assays. Each analyzed protein was statistically compared with its respectively control but protein levels were not compared among each other. Group abbreviations: CTRL-control mice; 2MAI-2 months after infection; +PBS 1M or 2M-plus 1 or 2 months after PBS treatment; +MSC 1M or 2M-plus 1 or 2 months after MSC therapy.

