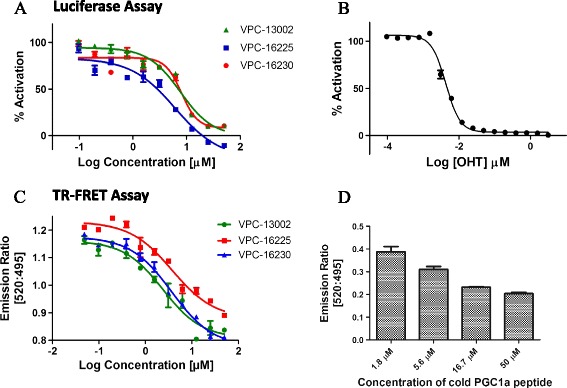
Figure 2.

The lead compounds inhibit oestrogen receptor-alpha transcriptional activity and coactivator binding at the activation function 2 site. (A) Dose–response curves (0.1 to 50 μM) of compounds VPC-13002, VPC-16225 and VPC-16230 (half-maximal inhibitory concentrations (IC50): 7.6, 8.24 and 5.81 μM, respectively) showing inhibition of the oestrogen receptor-alpha (ERα) transcriptional activity as measured by luciferase reporter assay in T47DKBluc cells. (B) Dose–response curve (0.000006 to 3 μM) of 4-hydroxytamoxifen (4-OHT) (IC50: 4.2 nM) showing inhibition of the ERα transcriptional activity as measured by luciferase reporter assay in T47D KBluc cells. Data were fitted using GraphPad Prism 5 software to calculate the log of the concentration of the inhibitors versus percentage activation. (C) Dose–response curves (0.1 to 50 μM) of compounds VPC-13002, VPC-16225 and VPC-16230 (IC50: 2.46, 3.76 and 2.98 μM, respectively) for displacement of the PGC-1α peptide from the activation function 2 (AF2) site as measured by time-resolved fluorescence resonance energy transfer (TR-FRET) assay. (D) Dose-dependent (1.8 to 50 μM) behaviour of cold peroxisome proliferator-activated receptor gamma, coactivator 1-alpha (PGC-1α) peptide for displacement of the fluorescein-PGC-1α peptide from the AF2 site as measured by TR-FRET assay. Data were fitted using GraphPad Prism 5 software to calculate the log of the concentration of the inhibitors versus the emission ratio. Data points represent the average of two independent experiments performed in triplicates. Error bars indicate standard error of mean for n = 6 values.
