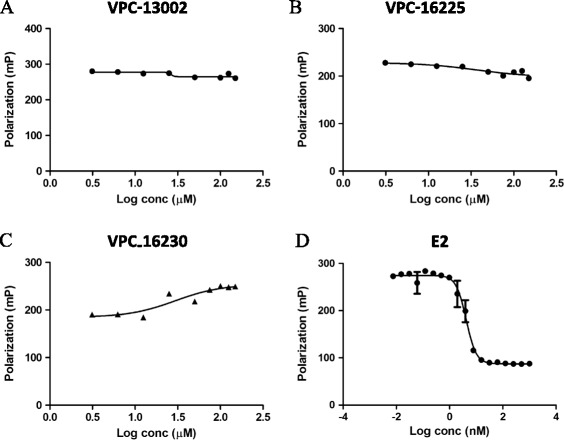
Figure 4.

The lead compounds did not displace oestradiol from the hormone-binding site of oestrogen receptor-alpha. Dose–response curve (3 to 150 μM) of (A) VPC-13002, (B) VPC-16225, (C) VPC-16230 and (D) oestradiol (E2) (0.01 to 1000 nM; half-maximal inhibitory concentration: 4.2 nM) for displacement of fluorescein-labelled E2 in fluorescence polarisation assays. Data were fitted using GraphPad Prism 5 to calculate the log of the concentration of the inhibitors versus polarisation.
