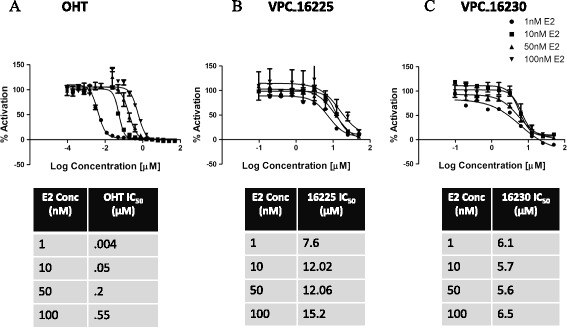
Figure 5.

The dose–response curves of the lead compounds did not shift in the presence of higher concentrations of oestradiol. (A) Dose–response curves (0.000095 to 50 μM) of 4-hydroxytamoxifen (OHT) showing a rightward shift proportional to the fold increase in concentrations of oestradiol (E2) generated by the luciferase assay in the T47D-KBluc cell line. Dose–response curves (0.1 to 50 μM) of (B) VPC-16225 and VPC-16230 (C) showing no significant rightward shift in the presence of higher concentrations of E2 as measured by luciferase assay in the T47D-KBluc cell line. Error bars indicate standard error of mean for n = 6 values. Data were fitted using GraphPad Prism 5 to calculate the log of concentration of the inhibitors versus percentage activation.
