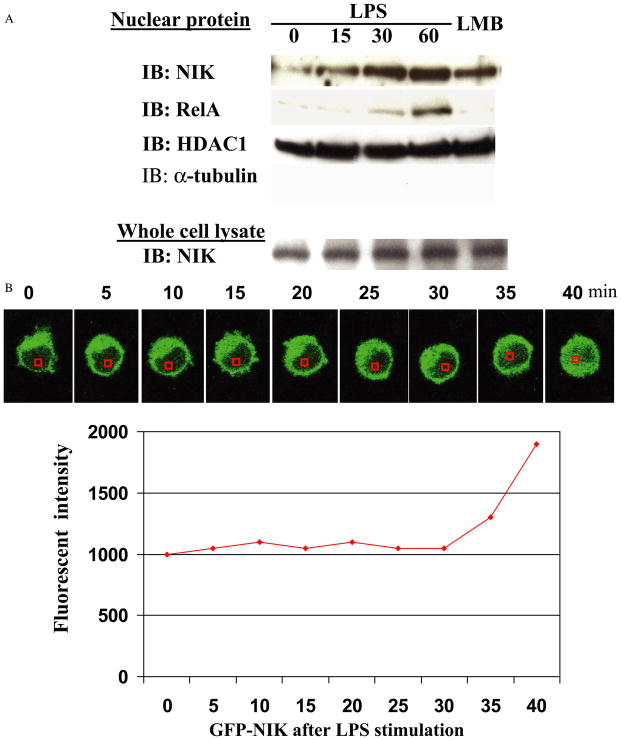
FIGURE 5.
A, RAW cells were treated with endotoxin for various time points. The nuclear protein was extracted and blotted with anti-NIK, RelA, HDAC1, and α-tubulin antibodies. The whole cell lysate was also blotted with anti-NIK to show the total amount of NIK. B, RAW cells were cultured in glass bottom microwell dishes (MatTek) and transfected with GFP-NIK. After 24 h, the cells were stimulated with lipopolysaccharide (LPS)(100 ng/ml). The live image of GFP fluorescence was taken at 5-min intervals by confocal microscopy. During this process, the cells were kept in 37 °C and phenol red-free media. The intensity of fluorescence in the nucleus was quantified with a Zeiss LSM image viewer (Zeiss). IB, immunoblot; LMB, leptomycin B.

