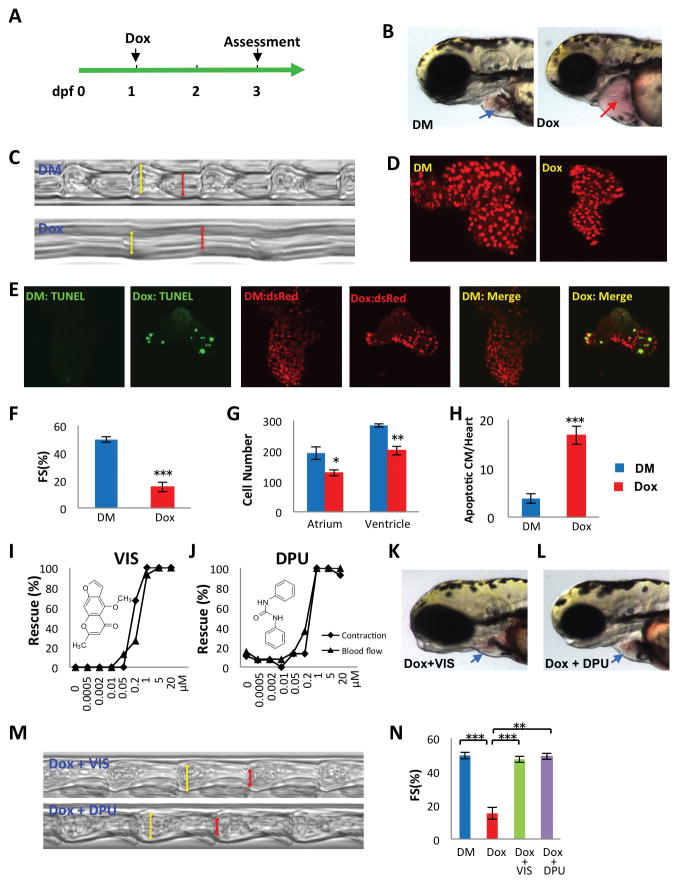
Fig 1. Discovery of doxorubicin suppressors VIS and DPU in a doxorubicin-induced cardiomyopathy model in zebrafish.
(A) Experimental scheme for inducing cardiomyopathy in zebrafish. (dpf, days post fertilization; Dox, doxorubicin) (B) Representative images of a normal heart (blue arrow) and doxorubicin-treated heart (red arrow).(DM, DMSO control) (C, M) Images reflecting heart contraction over time, derived from a region of interest drawn across the ventricle in sequential frames of high speed video of the beating heart. (D) Representative images of cardiomyocytes genetically labeled with nuclear dsRed driven by a cardiomyocyte-specific myl7 promoter. (E) Detection of apoptotic cardiomyocyte by TUNEL staining. Green, TUNEL, red, cardiomyocytes, yellow, apoptotic cardiomyocytes. (F,N) Quantification of fractional shortening (FS) as follows (VIDd-VIDs)/VIDd ×100. VIDd, diastolic ventricular internal dimension; VIDs, systolic ventricular internal dimension. n = 13–19 fish in each group, compared using Student’s T-test. (G) Quantification of cardiomyocyte number. n = 5 fish in each group, compared using Student’s T-test. (H) Quantification of apoptotic cardiomyocytes (CM). n = 5 fish in each group, compared using Student’s T-test. (I,J) VIS and DPU rescued heart contraction and blood flow in a dose dependent manner, as manifested by the percentage of normal looking fish out of total number of doxorubicin treated fish (K,L) Representative images showing grossly normal heart morphology in VIS or DPU rescued zebrafish. DM, DMSO treated control samples; Dox, doxorubicin treated samples; Dox + VIS, doxorubicin and VIS co-treated samples; Dox + DPU, doxorubicin and DPU co-treated samples. Statistics (compared to doxorubicin treated samples): * p< 0.05, ** p<0.01, and *** p<0.001.

