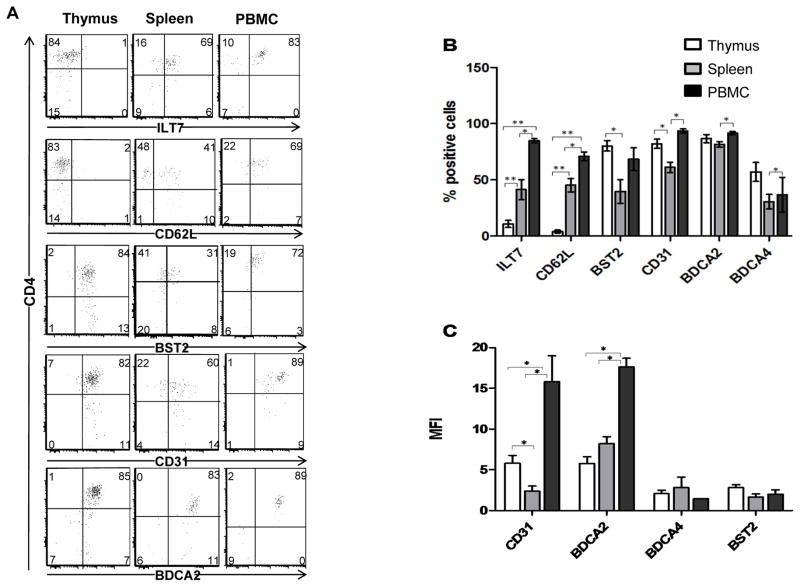
Figure 2. pDC in the thymus present an activated “IFN-α signature” phenotype.
A) Multicolor flow cytometry was performed on total thymocytes, fetal splenocytes and PBMC. pDC were gated as CD123+CD45RA+CD3−CD1a−CD4+ cells, and assessed for the expression of: ILT7, CD62L, BST2, CD31, BDCA2 and BDCA4. B) Mean percentages of positive cells ± SD from independent donors analyzed as in A. Thymus, n = 11; spleen, n = 4; PBMC, n = 4. C) Mean fold difference in MFI ± SD that were calculated as: MFI of antigen/MFI of IgG control [35] from: 11 thymus, 4 fetal spleen and 4 PBMC from independent donors analyzed as in A. *p<0.05, **p<0.01 as calculated using the Mann Whitney test.

