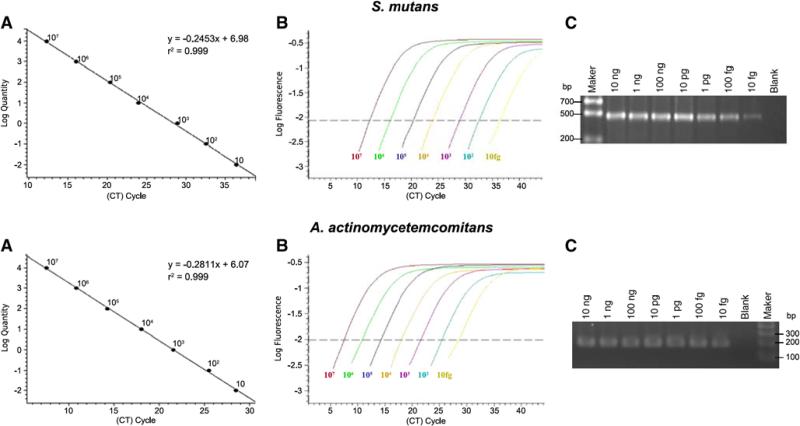
Fig. 1.
Quantitative real-time polymerase chain reaction (qPCR) validation. a Standard curves for Streptococcus mutans (UAI59) and Aggregatibacter actinomycetemcomitans (ATCC29522) generated from a plot of threshold cycle (C,) values against log value for the tenfold serial dilutions of known concentrations (107–10 fg/μl). b The amplification plot obtained using SYBR Green I assay for S. mutans and A. actinomycetemcomitans. c The confirmations of the qPCR amplification detected on 1.5% agarose gels. As expected, the sizes of S. mutans and A. actinomycetemcomiwns amplicons are 479 and 194 bp, respectively

