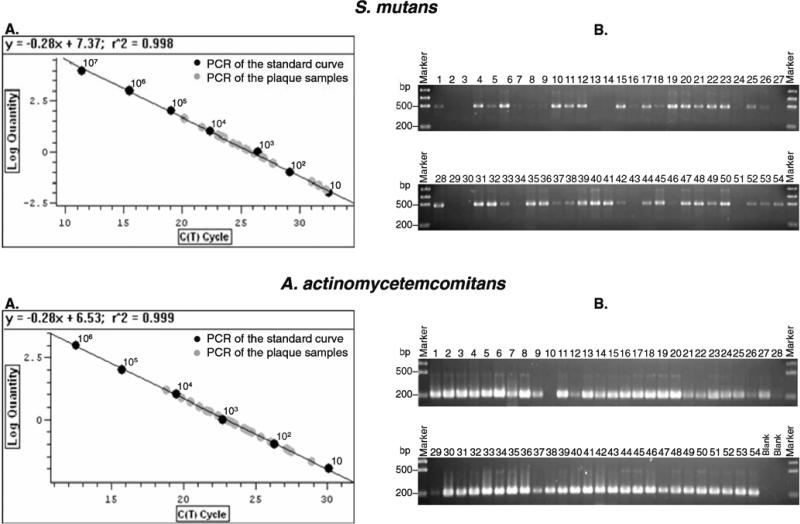
Fig. 2.
Quantitative real-time polymerase chain reaction (qPCR) for plaque samples. a The linear standard curve was generated based on the log concentration of known DNA samples of Streptococcus mutans (UA 159) and Aggregatibacter actinomycetemcomitans (ATCC 29522) (black circle) and the plaque samples (gray circle). b The qPCR final results were confirmed on a 1.5% agarose gel

