
Figure 5.
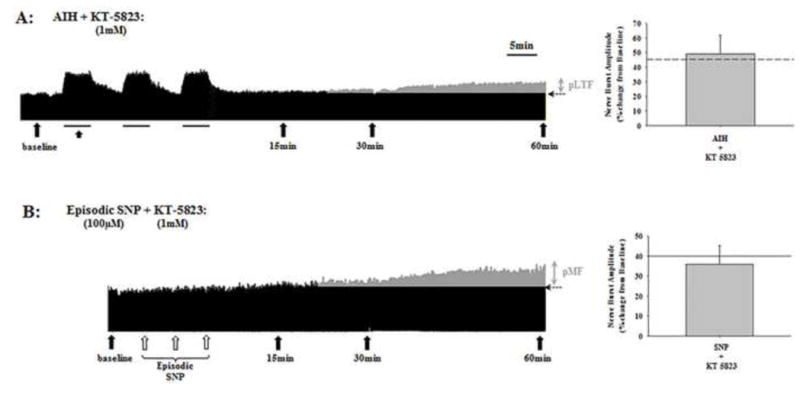
Representative neurograms of AIH-induced pLTF (A) and SNP-induced pMF (B) following pre-treatment with the PKG inhibitor, KT-5823. To the right of each neurogram is the mean average of pLTF and pMF at 60 min post-hypoxia or SNP, respectively; for comparison, dashed (A) or solid (B) lines in the bar graphs illustrate magnitude of AIH-induced pLTF and SNP-induced pMF, respectively. Filled arrows indicate blood sampling; open arrows in B indicate individual SNP injections; horizontal dashed arrows at the end of each trace indicate baseline nerve activity. Grey areas in A and B indicates nerve activity above baseline after AIH or SNP injections. PKG inhibition had no effect on AIH-induced pLTF or SNP-induced pMF.