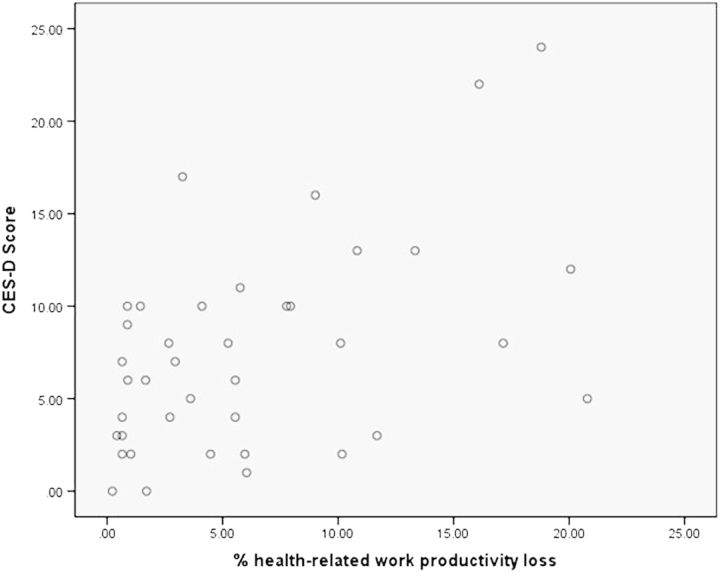
Fig. 1.
Percent of health-related work productivity loss as a function of CES-D score. A scatterplot was generated to visualize each participant's percent of health-related work productivity loss as measured on the WLQ (X-axis) as a function of individual CES-D scores, which are a measure of depressive symptomatology (Y-axis). There appears to be a trend towards increased percent of work-productivity loss with higher levels of depressive symptoms.

