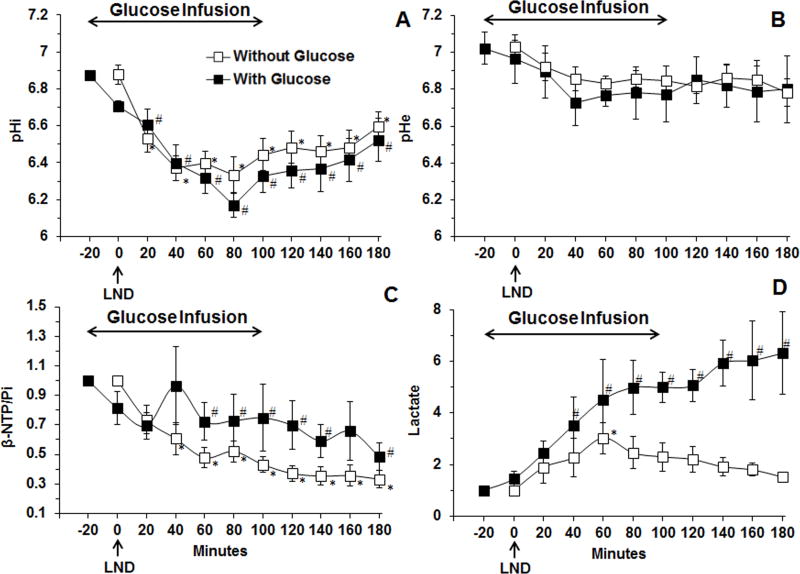
Figure 2.
(A) The intracellular pH (pHi,) (n = 10), (B) extracellular pH (pHe) (n = 7) (C) changes of βNTP/Pi (ratio of peak area) relative to baseline (n = 11) (D) changes in tumor lactate, area under the curve was compared to baseline at each time points and was normalized to baseline profile (n=4) as a function of time with infusion of glucose (26 mM) of human melanoma xenografts in response to LND (100 mg/kg; i.p.) administration at time zero after 20 min i.v. infusion of glucose (26 mM) (filled squares). The pHi, pHe, bioenergetics (βNTP/Pi) and lactate data without infusion of glucose (open squares) were adapted from previously published data (7). Baseline measurements for glucose infusion studies were performed at −20 min, up to 100 min for duration of 120 min whereas, baseline without the addition of exogenous and before LND administration were done at 0 min. The values are presented as mean ± S.E.M. When not displayed, S.E.M. values were smaller than the symbol size. *, # statistically significant (p<0.05) relative to starting levels for experiments, without glucose, and with glucose respectively.

