Figure 1.
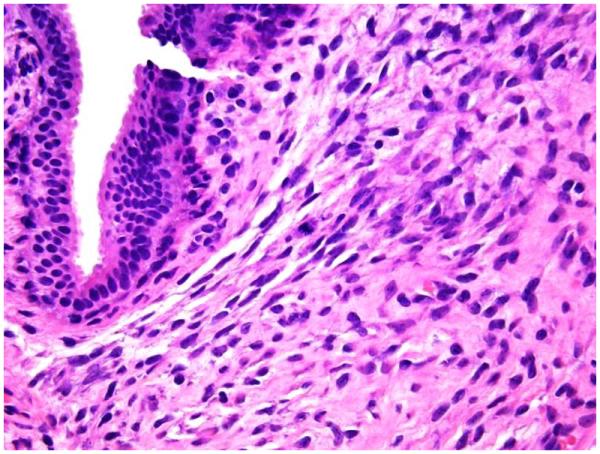
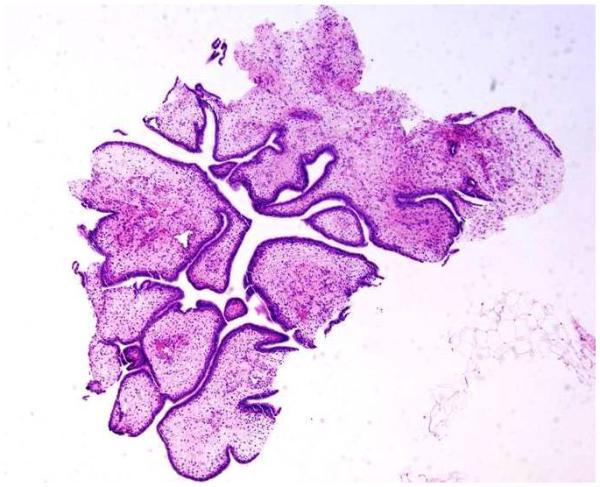
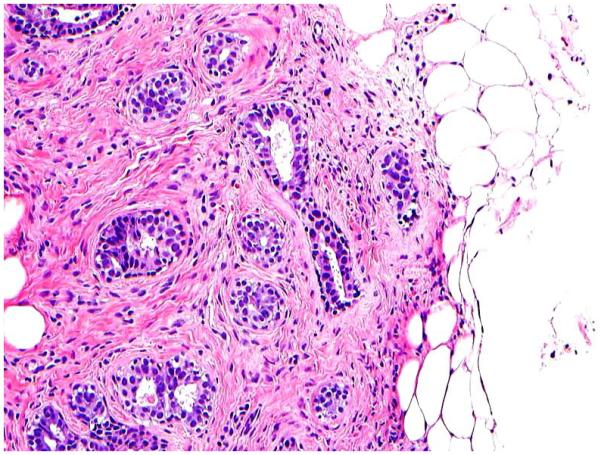
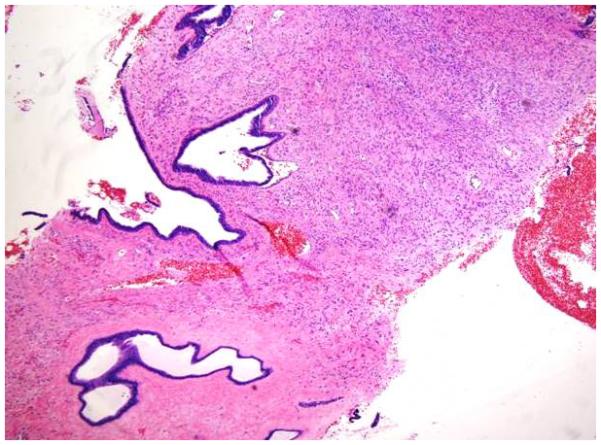
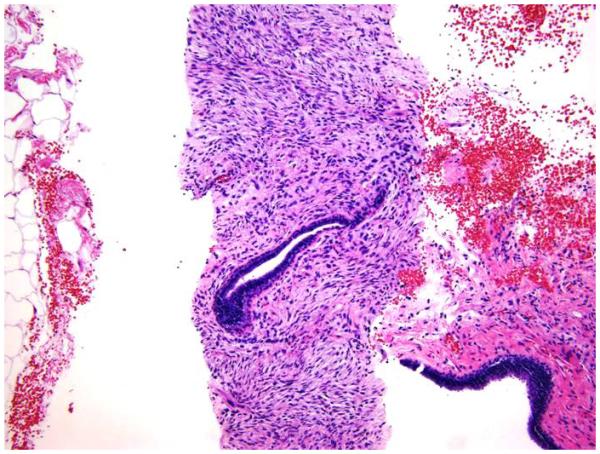
1A: Stromal mitotic activity on 40 x microscopic power magnification (H&E; 40x);
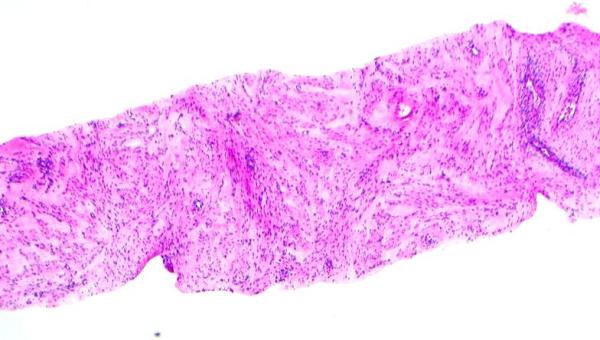
1B: Stromal overgrowth (absence of epithelial component) identified in CNB specimen at 10 x microscopic power magnification (H&E; 10x);
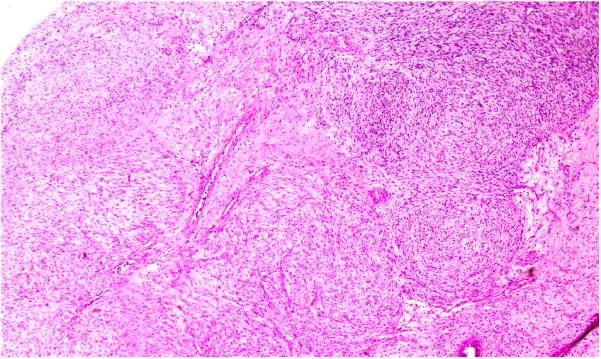
1C: Stromal overgrowth (absence of epithelial component) on excision specimen at 4 x microscopic power magnification H&E; 4x);
1D: Increased stromal cellularity (H&E; 20x);
1E: Stromal fragmentation. Stromal fragments completely lined by epithelial cells (H&E; 4x);
1F: Adipose tissue infiltration (H&E; 4x);
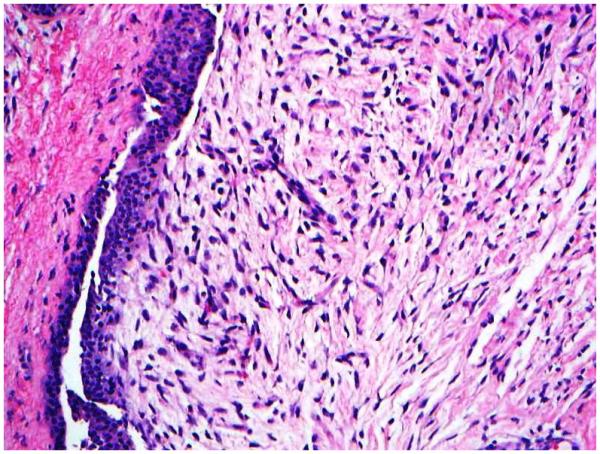
1G: Stromal heterogeneity. Two different areas of the same tumor demonstrate heterogeneity in terms of difference in stromal cellularity and stromal atypia. The stroma is fibrotic (1g) in one area and hypercellular in another area (1h) (H&E; 20x).
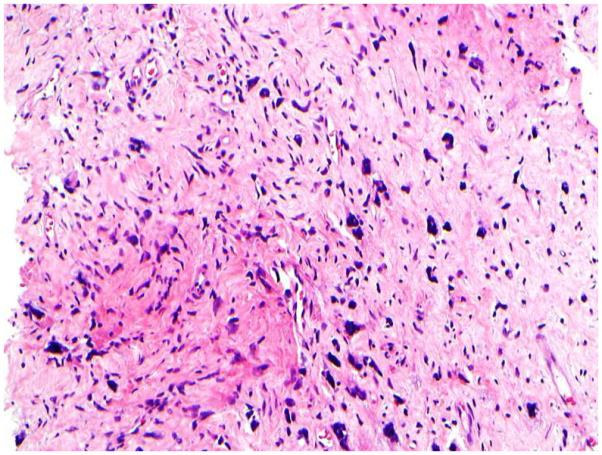
1H: Stromal heterogeneity. Two different areas of the same tumor demonstrate heterogeneity in terms of difference in stromal cellularity and stromal atypia. The stroma is fibrotic (1g) in one area and hypercellular in another area (1h) (H&E; 20x).
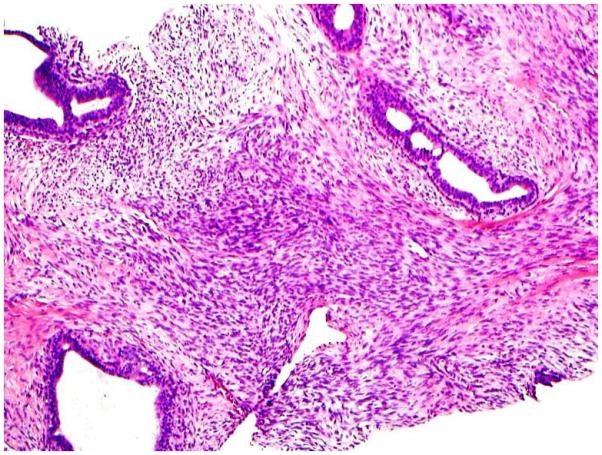
1I: Subepithelial stromal condensation (H&E; 10x);
1J: Stromal cells demonstrate moderate to severe nuclear pleomorphism and hyperchromasia (H&E; 40x)
