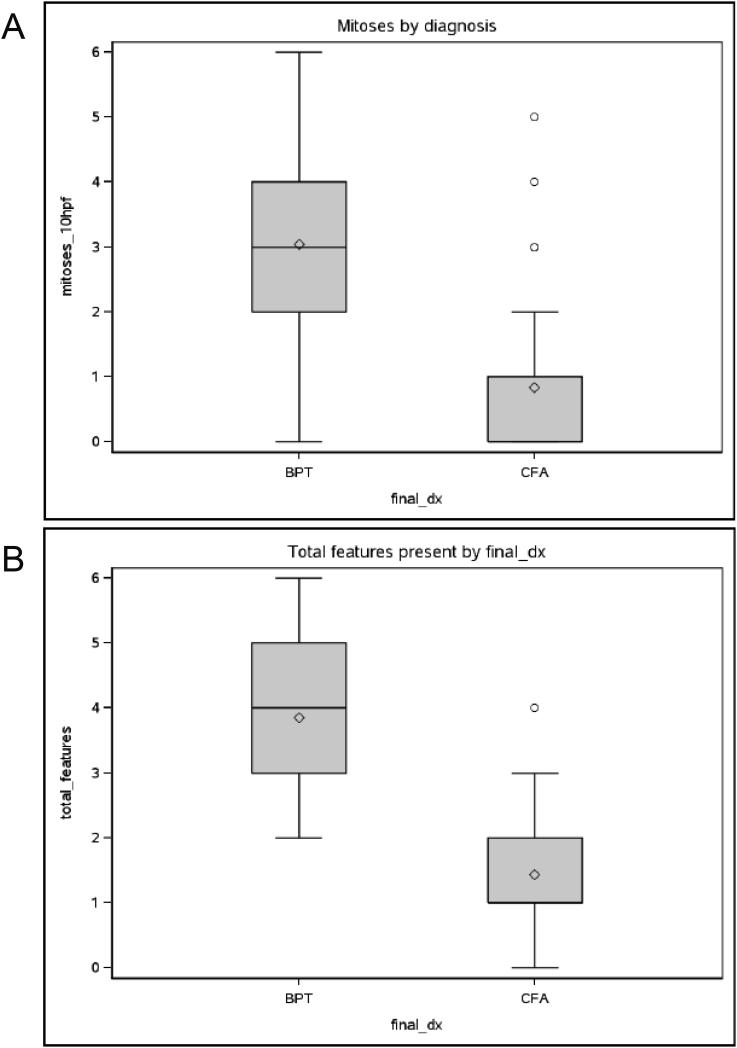
Figure 2.
The boxplots below show the difference in mitoses (2A) and total number of histologic features (2B) between the groups. Note how little they overlap. To interpret the boxplots, the shaded box shows the middle 50% of the data (between the 25th and 75th percentiles), along with the median shown as the horizontal line in the middle of the box – note, that the median and 25th percentile are equal among those with CFA for each of these two measures. The mean is shown by the diamond.

