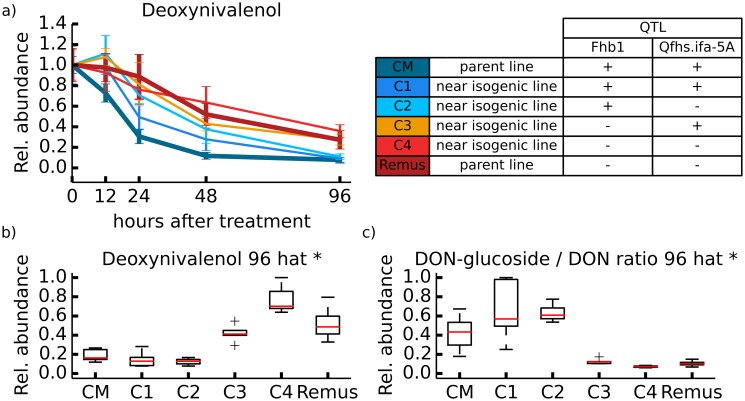
Fig 3. Overview on DON degradation.
Time course for the degradation of DON (1 mg) of wheat lines ‘CM-82036’, C1, C2, C3, C4 and ‘Remus’. Wheat ears were sampled 0, 12, 24, 48, and 96 hours after treatment (n = 5 biological replicates per time point and wheat line). a) Degradation rate of DON. b) boxplot of relative concentrations 96 h after DON treatment. c) DON-glucoside/DON ratio 96 h after DON treatment. * Significantly differing DON levels between wheat lines with and without resistance QTL Fhb1 based on a non-paired t-test (5% global significance threshold).

