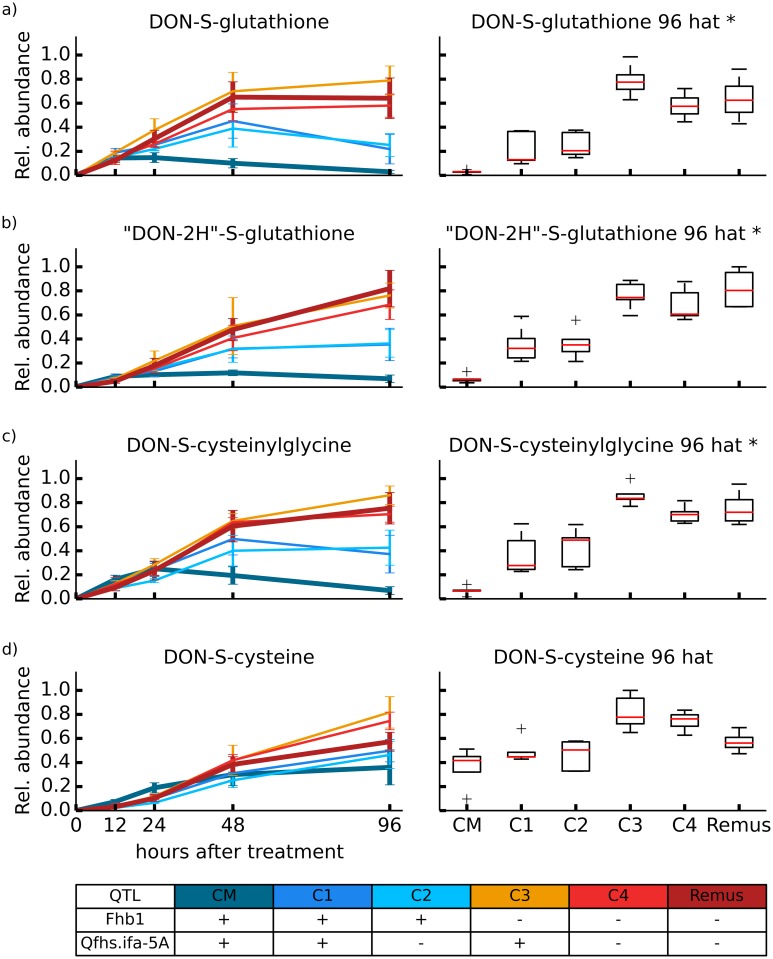
Fig 5. Detoxification of DON via glutathione pathway.
Glutathione pathway related detoxification of DON. Relative formation rates for biotransformation products DON-S-glutathione (a) and its related degradation products “DON-2H”-S-glutathione (b), DON-S-cysteinylglycine (c) and DON-S-cysteine (d). Additionally, for each biotransformation product boxplots for relative metabolite abundance observed 96 h after DON treatment were generated. * Significantly differing biotransformation product levels between wheat lines with and without resistance QTL Fhb1 based on a non-paired t-test (5% global significance threshold).

