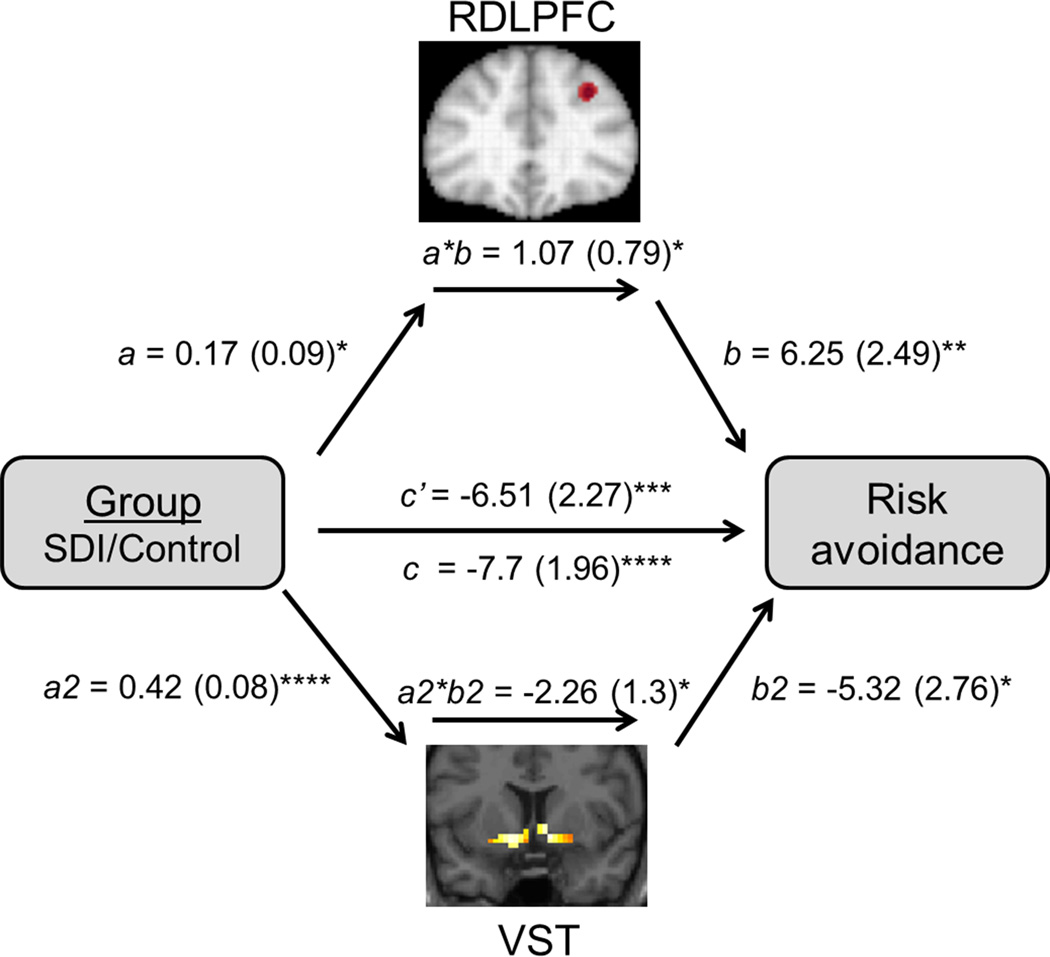
Figure 2. Single-level mediation analysis.
RDLPFC and VST oppositely mediate group differences in risk avoidance. Path coefficients are shown next to arrows with standard errors in parentheses. Path a is from the group (X) to the RDLPFC (M1). Path b is from RDLPFC (M1) to risk avoidance (Y). Path a2 is from the group (X) to the VST (M2). Path b2 is from VST (M2) to risk avoidance (Y). Paths b and b2 are calculated controlling for group (X). Paths a, b, and a*b control for VST (M2), and Paths a2, b2, and a2*b2 control for RDLPFC (M1). The direct path c’ is calculated controlling for both mediators. ****p<0.001, ***p<0.005, **p<0.01, *p<0.05, one-tailed; right dorsolateral prefrontal cortex (RDLPFC), ventral striatum (VST), mediator (M1, M2)

