
Figure 6.
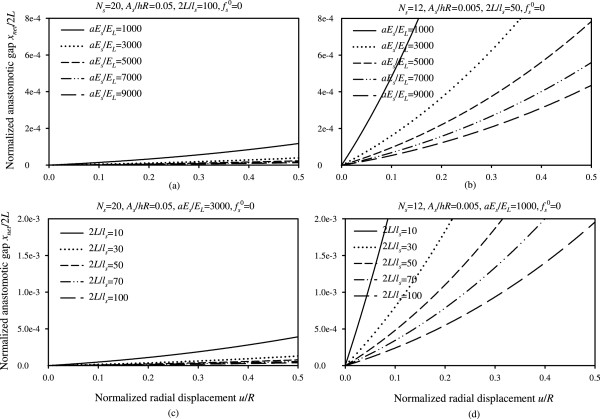
Normalized anastomotic gap versus normalized radial displacement. (a) Plots for different values of parameter aE
s/E
L and for N
s = 20, A
s/hR = 0.05, 2L/l
s = 100,  , (b) Plots for different values of parameter aE
s/E
L and for N
s = 12, A
s/hR = 0.005, 2L/l
s = 50,
, (b) Plots for different values of parameter aE
s/E
L and for N
s = 12, A
s/hR = 0.005, 2L/l
s = 50,  , (c) Plots for different values of parameter 2L/l
s and for N
s = 20, A
s/hR = 0.05, aE
s/E
L = 3000,
, (c) Plots for different values of parameter 2L/l
s and for N
s = 20, A
s/hR = 0.05, aE
s/E
L = 3000,  , (d) Plots for different values of parameter 2L/l
s and for N
s = 12, A
s/hR = 0.005, aE
s/E
L = 1000,
, (d) Plots for different values of parameter 2L/l
s and for N
s = 12, A
s/hR = 0.005, aE
s/E
L = 1000,  .
.