Figure 7.

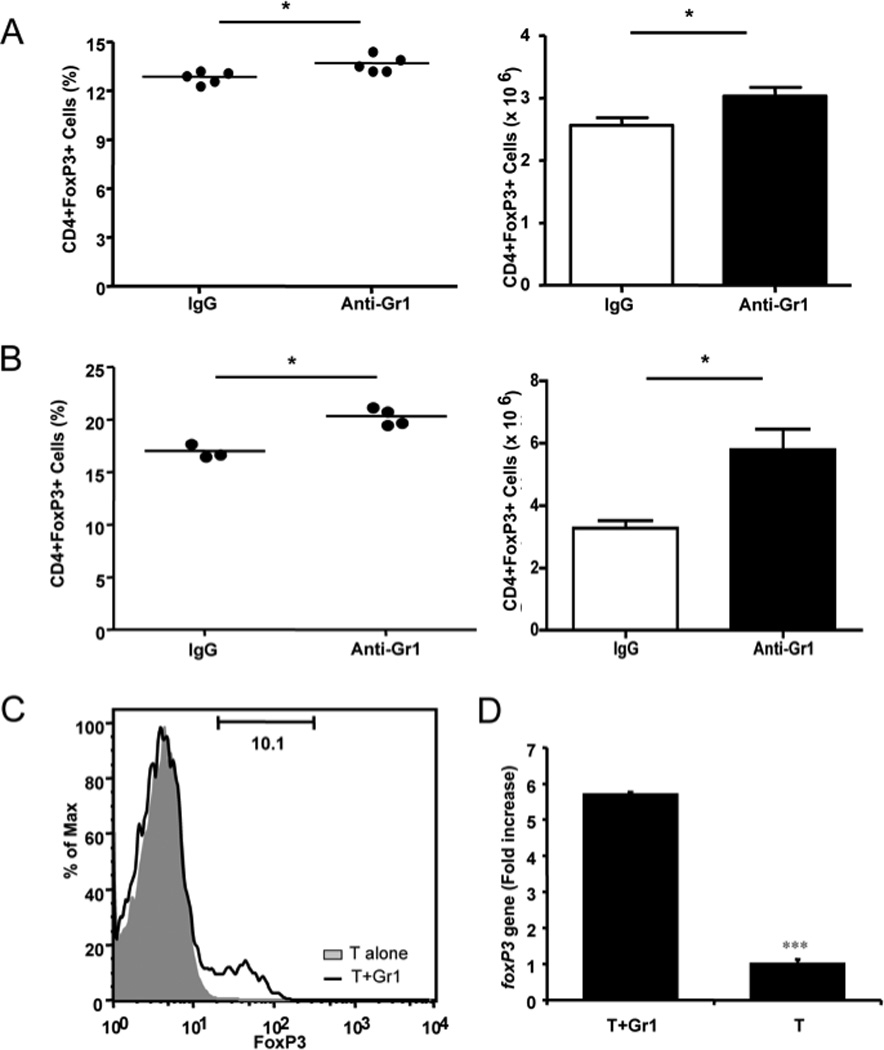
Anti-Gr1 treatment induced regulatory T cells. A) Percentage (left) and absolute numbers ± SEM (right) of splenic FoxP3+CD4 regulatory T cells from mice 1 month after control rat IgG or anti-Gr1 treatment. B) Percentage (left) and absolute numbers ± SEM (right) of regulatory FoxP3+CD4 T cells from splenocytes of the mice 6 months after control rat IgG or anti-Gr1 treatment. P values are shown on the graph (Student’s t test). C) Purified Gr1+CD11b+ cells were co-cultured with purified naïve T cells at 1:5 ratio for 5 days. The differentiation of naïve T cells into FoxP3+ regulatory T cells was determined by flow cytometry. D) FoxP3 mRNA was detected by quantitative PCR in the T cells cocultured with Gr1+CD11b+ cells (T+Gr1) compared with naïve T cells alone (T). Data from one of 4 representative experiments are shown. *p<0.05, ***p<0.0001.
