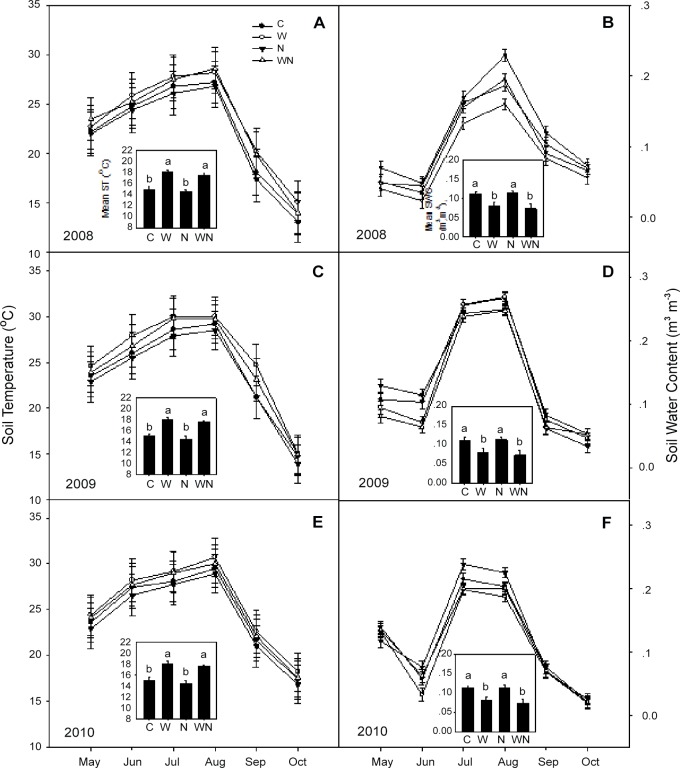
Fig 1. Effects of experimental warming and N addition on soil temperature and soil volumetric water content at a depth of 15 cm over the period 2008 to 2010.
C: Control; W: Warming; N: N addition; WN: Warming plus N addition. Vertical bars indicate the standard error of the mean (n = 6). Different lowercase letters indicate significant differences (P < 0.05) between treatments.

