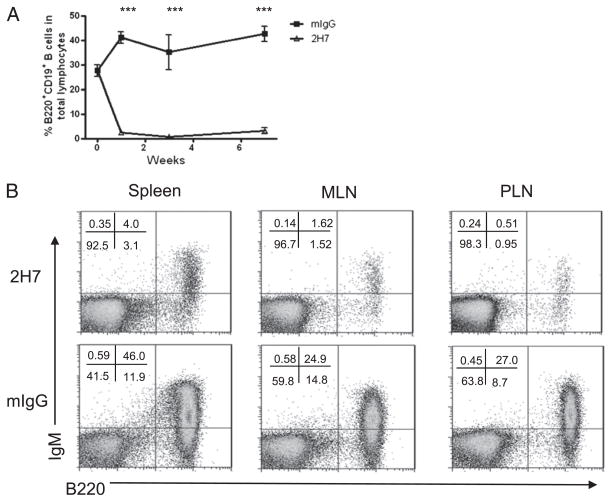
FIGURE 1.
B cell depletion in hCD20BDC2.5 NOD mice. (A) B cell profile in peripheral blood after depletion of B cells. After the first injection (500 μg), 250 μg was administered a week later, followed by three additional injections at 2-wk intervals. After removing erythrocytes, peripheral blood cells were costained with anti-CD19 and anti-B220 and analyzed by flow cytometry prior to the next injection. B cell (B220+CD19+) percentage in total lymphocytes is shown at different time points. Mean values ± SEM of six to eight mice are presented. (B) B cell depletion in different lymphoid organs. HCD20-BDC2.5NOD mice were treated with 2H7 (upper panel) or mIgG (lower panel). (B) shows representative depletion profiles of B cells (IgM+B220+) from spleen, MLN, and PLN when the mice shown in (A) were terminated (10 d after the last Ab injection).

