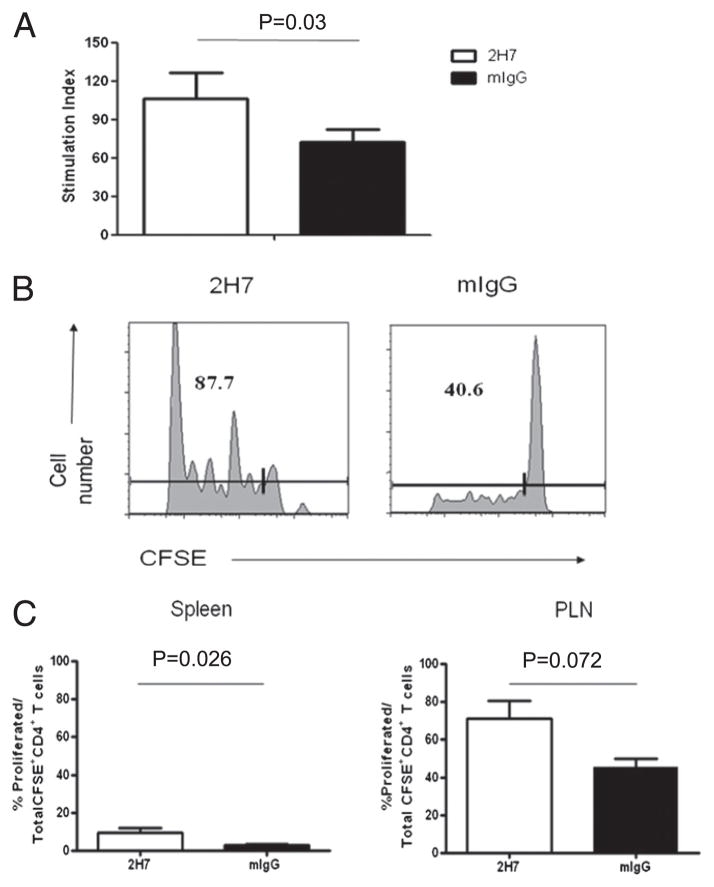
FIGURE 2.
Enhanced proliferation of BDC2.5 diabetogenic T cells after B cell depletion. (A) BDC2.5 T cell proliferation in vitro. Purified BDC2.5 CD4+ T cells from treated hCD20-BDC2.5NOD mice (n = 5) cocultured with irradiated NOD APCs in the presence or absence of BDC2.5 mimotope. Cell proliferation was shown as stimulation index = [3H]thymidine incorporation (cpm) in the presence of mimotope/[3H]thymidine incorporation in the absence of mimotope stimulation. The average [3H]thymidine incorporation (cpm) without mimotope stimulation was 513.3 ± 72.76. Similar results were obtained from three independent experiments. (B) Proliferation of BDC2.5 T cells in vivo. hCD20NOD mice were treated with 2H7 or mIgG as described in Materials and Methods. CFSE-labeled BDC2.5 CD4+ T cells (107) were injected into treated mice. Spleen and PLN were harvested from recipient mice 5 d later, and cell proliferation was determined by flow cytometric detection of CFSE dilution. Numbers indicate relative percentage of CFSE-diluted BDC2.5 T cells in PLN. (C) Summary of proliferation of BDC2.5 T cells in vivo. Numbers indicate the percentage of proliferated cells in total CFSE-labeled BDC2.5 T cells (n = 3/group). Similar results were obtained from two independent experiments.

