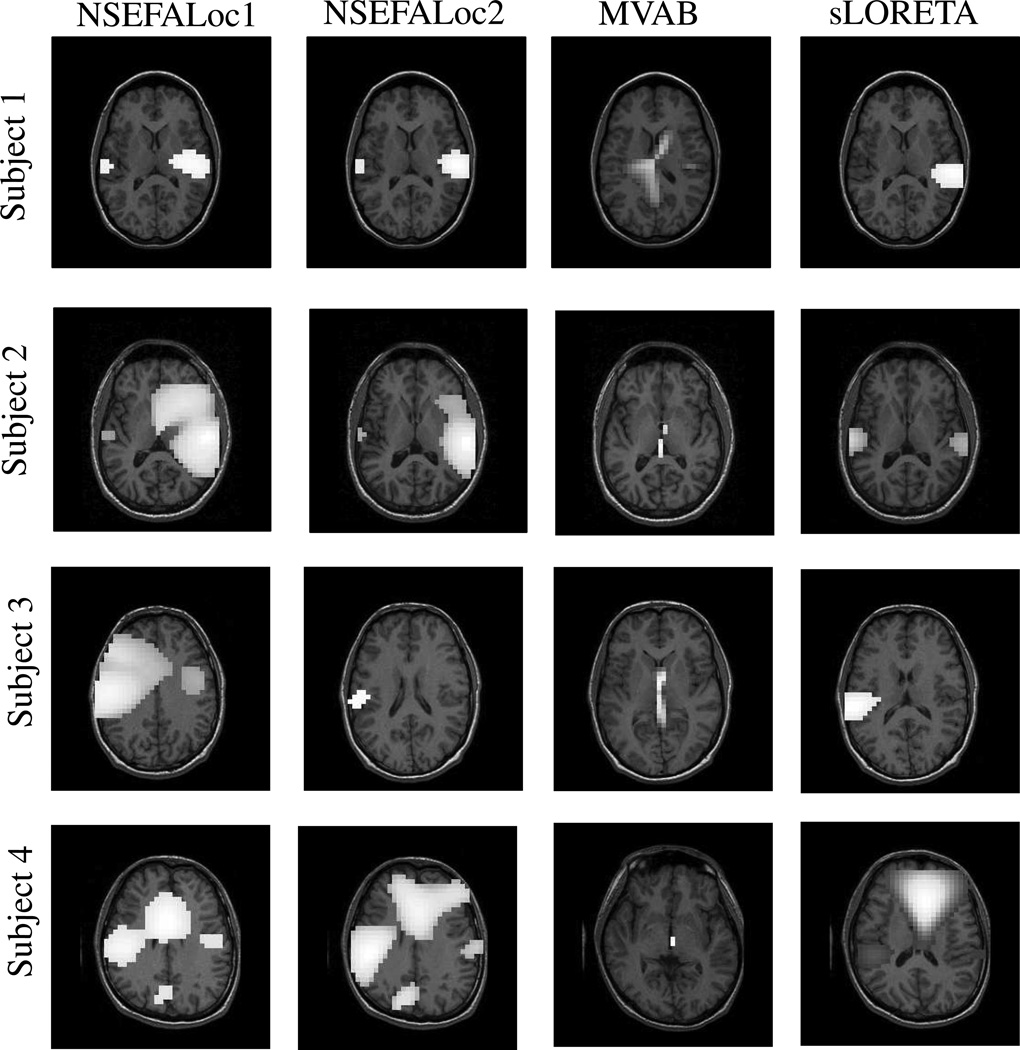
Fig. 11.
Performance of methods on real auditory evoked MEG datasets from two healthy human subjects. NSEFALoc1 and NSEFALoc2 results are likelihood maps and MVAB and sLORETA are power maps. The thresholds were set to portray each method optimally (i.e. including as many true sources as possible while not including other areas).

