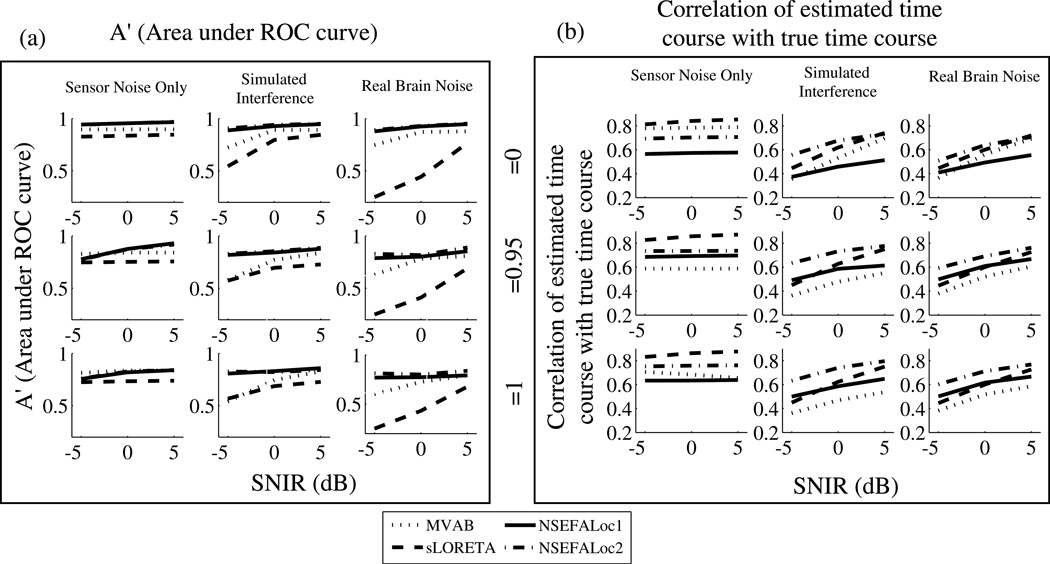
Fig. 5.
Performance of NSEFALoc1 and NSEFALoc2 relative to MVAB and sLORETA for variety of simulated datasets. Each datapoint is an average of 40 simulations, consisting of two different source locations and either a fixed or rotating source orientation. Standard errors were less than 0.05 for all points (not shown). (a) A measure of area under ROC curve A′ is plotted in 9 subplots as a function of SNIR for sensor noise only, simulated and real brain interference (across columns), and for each of three source correlation values (across rows). See text for discussion of the A′ metric. (b) The correlation of the estimated with the true time course is plotted for each method.

