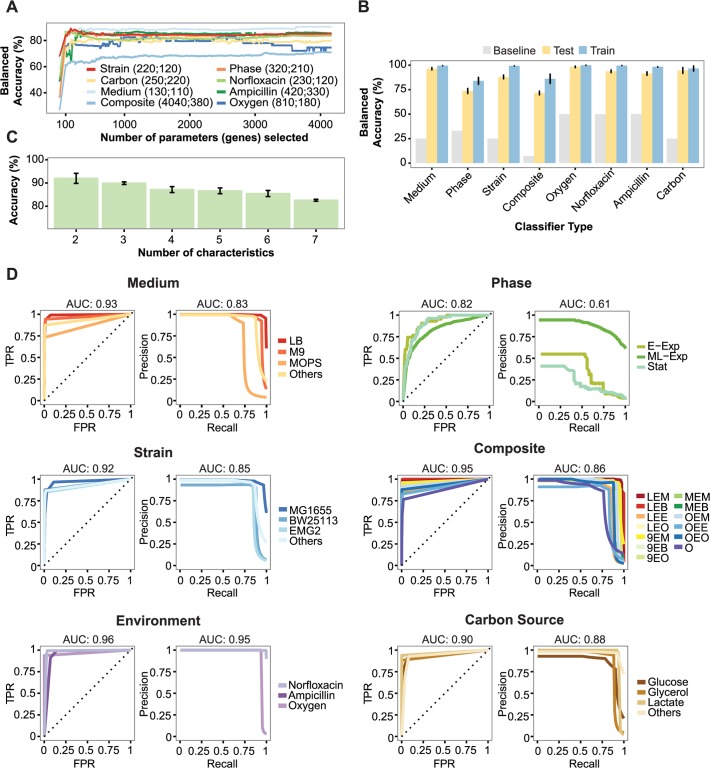
Fig 3. Classification performance.
(A) Balanced accuracy in testing set for the 8 classification tasks as a function of number of genes selected. Genes (x-axis) are ordered by the mutual information of their expression to the predictor variable. For each classifier, the optimal number of features (derived from the training data) and the minimum number of genes at near-optimal (within 2%) classification are shown in the legend (first and second value, respectively). (B) Leave-one-batch-out cross-validation, with the training and testing balanced accuracy for each classifier is compared with the baseline. The baseline is estimated by dividing the maximum accuracy (100) by the number of classes for any given characteristic. (C) Combined multi-modal predictions using a set of individual classifiers. The parameter k represents the number of characteristics to be classified (two antibiotics, aerobic or anaerobic respiration, medium, phase and strain), represents all possible combinations and increases from 2 to 7 (x-axis). The average accuracy for each combination of k characteristics to be predicted is reported. (D) ROC curve (left) and PR curve (right) for predictor of each characteristic (TPR; true-positive rate, FPR; false-positive rate, E-Exp; early exponential phase, M/L-Exp; mid/late exponential phase, Stat; stationary phase).

